
在同一图形上有不同x范围的两幅图,具有渐近性
在同一图形上有不同x范围的两幅图,具有渐近性
提问于 2022-09-11 11:56:33
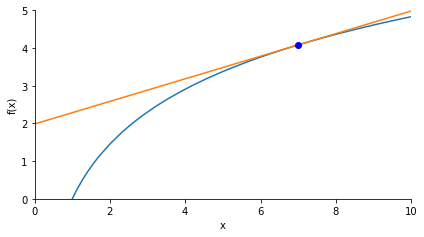
我正在绘制一个函数的曲线,它在p点是正切的,我想独立地管理曲线和切线的xlim。在此代码中,切线半长应为1:
from sympy import init_printing, symbols, N, plot
from sympy import diff
from sympy import log, cos, atan

init_printing()
x = symbols('x')

# Plot a tangent at point (p_x, p_y), of length l
def plot_line(p_x, p_y, x, a, l):
    # Compute b, build tangent expression
    b = p_y - a*p_x
    t = a*x + b

    # Limit line length
    r = atan(a) # angle in rad
    dx = N(l*cos(r)) # half range for x
    lims = {'xlim': (p_x-dx, p_x+dx)}

    # Build plot
    t_plot = plot(t, show=False, **lims)
    return t_plot

# Function
y = 2.1*log(x)

# Point
px = 7
py = y.subs(x, px)

# Plot curve and point
marker = {'args': [px, py, 'bo']}
lims = {'xlim': (0,10), 'ylim': (0,5)}
plots = plot(y, markers=[marker], show=False, **lims)

# Find derivative, plot tangent
y_d = diff(y)
a = y_d.subs(x, px)
plots.extend(plot_line(px, py, x, a, 1))

# Finalize and show plots
plots.aspect_ratio=(1,1)
plots.show()
但事实并非如此..。
回答 1
Stack Overflow用户
回答已采纳
发布于 2022-09-11 12:15:58
SymPy的plot()函数签名类似于以下内容:
plot(expr, range, **kwargs)其中range是一个三元元组:(symbol, min_val, max_val)。plot函数将计算从min_val到max_val的expr。
**kwargs之一是xlim,它是一个2元素元组:xlim=(x_min, x_max)。它用于限制从x_min到x_max沿x轴的可视化.尽管如此,由plot函数计算的数值还是从min_val到max_val。
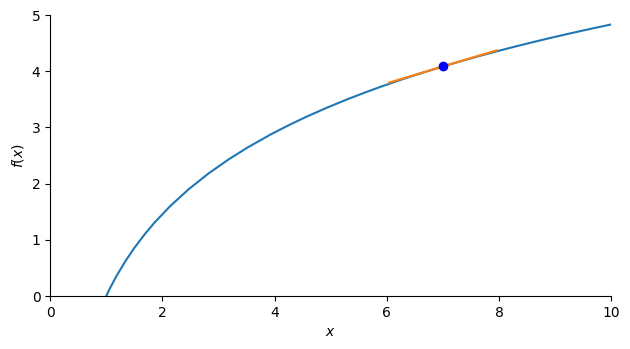
尽管如此,您需要从xlim内部删除plot_line并提供range参数:
from sympy import init_printing, symbols, N, plot
from sympy import diff
from sympy import log, cos, atan

init_printing()
x = symbols('x')

# Plot a tangent at point (p_x, p_y), of length l
def plot_line(p_x, p_y, x, a, l):
    # Compute b, build tangent expression
    b = p_y - a*p_x
    t = a*x + b

    # Limit line length
    r = atan(a) # angle in rad
    dx = N(l*cos(r)) # half range for x

    # Build plot
    # Need to provide the range to limit the line length
    t_plot = plot(t, (x, p_x-dx, p_x+dx), show=False)
    return t_plot

# Function
y = 2.1*log(x)

# Point
px = 7
py = y.subs(x, px)

# Plot curve and point
marker = {'args': [px, py, 'bo']}
lims = {'xlim': (0,10), 'ylim': (0,5)}
plots = plot(y, markers=[marker], show=False, **lims)

# Find derivative, plot tangent
y_d = diff(y)
a = y_d.subs(x, px)
plots.extend(plot_line(px, py, x, a, 1))

# Finalize and show plots
plots.aspect_ratio=(1,1)
plots.show()
页面原文内容由Stack Overflow提供。腾讯云小微IT领域专用引擎提供翻译支持
原文链接:
https://stackoverflow.com/questions/73679059
复制相关文章
相似问题
腾讯云开发者

Copyright © 2013 - 2026 Tencent Cloud. All Rights Reserved. 腾讯云 版权所有
深圳市腾讯计算机系统有限公司 ICP备案/许可证号:粤B2-20090059 ![]() 粤公网安备44030502008569号
粤公网安备44030502008569号
腾讯云计算(北京)有限责任公司 京ICP证150476号 | 京ICP备11018762号