
在Makie.jl中,密度图的阴影范围如何?
在Makie.jl中,密度图的阴影范围如何?
提问于 2022-09-07 03:14:15
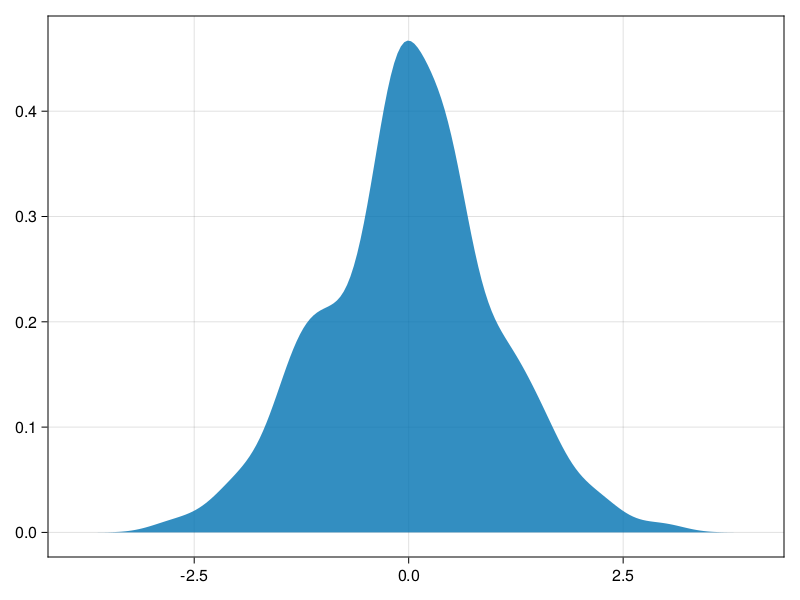
我怎样才能把中间50%的密度画成不同颜色的蓝色(或不同的阿尔法透明度)?
using CairoMakie

f = Figure()
Axis(f[1, 1])

density!(randn(200))

f
回答 2
Stack Overflow用户
回答已采纳
发布于 2022-09-07 11:34:03
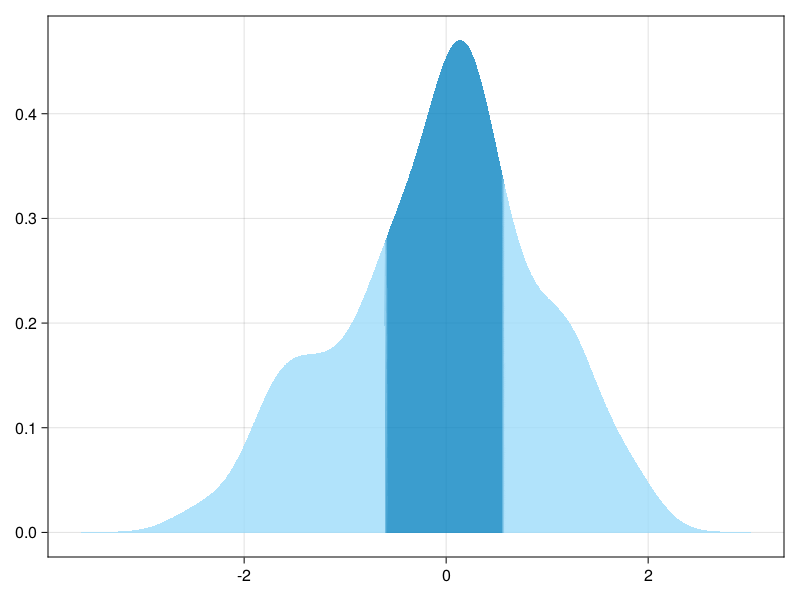
这个答案是@flurble答案的一个发展,它完成了寻找正确选项和参数的所有困难部分。为了使它更有用,我添加了一个助手函数,并从使用分类颜色映射切换到连续的颜色映射(这更容易操作)。代码如下所示:
using CairoMakie, Colors, ColorSchemes, Random, StatsBase

# generate 'square' color gradient
in_out_colorscheme(outcolor, incolor, eps=0.00000001) =
    cgrad([outcolor, incolor, incolor, outcolor], [0.0,eps,1.0-eps,1.0])

out_blue = HSLA(200,0.9,0.8,0.8)
in_blue = HSLA(200,0.9,0.4,0.8)
blue_in_blue = in_out_colorscheme(out_blue, in_blue);

# generate some data
data = begin
    Random.seed!(14)
    randn(200)
end;

# the region to highlight will be a 50% quantile interval
your_x_min, your_x_max = quantile(data, (0.25,0.75))

begin
    f = Figure()
    ax = Axis(f[1, 1])
    density!(data,
#       strokecolor = out_blue, strokewidth = 2, strokearound = true,
        color=:x,
        colormap=blue_in_blue,
        colorrange=(your_x_min,your_x_max)
    )
    f
end
结果是:
PS,奇怪的begin-end块起源于冥王星笔记本细胞,这段代码是用它写的。
Stack Overflow用户
发布于 2022-09-07 10:00:16
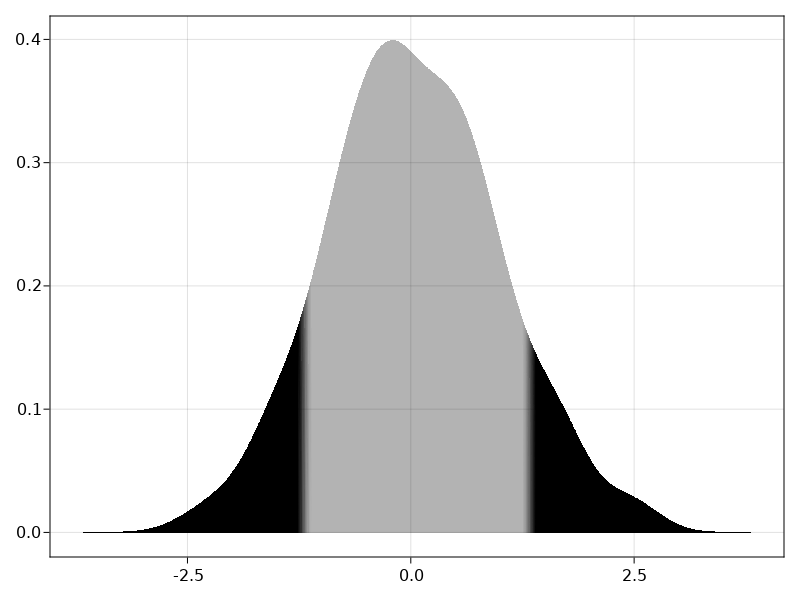
您需要将图形的x轴映射到颜色值color=:x。然后使用具有透明度的彩色地图。在这里,我使用HSLA值(Hue、饱和值、亮度、alpha值)手动定义一个,只改变颜色的alpha值。colormap=cgrad([HSLA(0,0,0,1), HSLA(0,0,0,.3), HSLA(0,0,0,1)], 3, categorical=true)
这将阴影的中间部分,你的密度区域,以透明的颜色。在那之后,它只是归结为微调的颜色过渡的限制。例如,您可以向绘图调用提供colorrange参数。
总之,这使它:
using CairoMakie, Colors, ColorSchemes

f = Figure()
ax = Axis(f[1, 1])

density!(ax, randn(200),
    color=:x,
    colormap=cgrad([HSLA(0,0,0,1), HSLA(0,0,0,.3), HSLA(0,0,0,1)], 3, categorical=true),
    colorrange=(your_x_min,your_x_max),
    )

f
页面原文内容由Stack Overflow提供。腾讯云小微IT领域专用引擎提供翻译支持
原文链接:
https://stackoverflow.com/questions/73629698
复制相关文章
相似问题
腾讯云开发者

Copyright © 2013 - 2026 Tencent Cloud. All Rights Reserved. 腾讯云 版权所有
深圳市腾讯计算机系统有限公司 ICP备案/许可证号:粤B2-20090059 ![]() 粤公网安备44030502008569号
粤公网安备44030502008569号
腾讯云计算(北京)有限责任公司 京ICP证150476号 | 京ICP备11018762号