
如何创建两个相互相邻的堆叠条形图。我想重新创建下面的图表:
如何创建两个相互相邻的堆叠条形图。我想重新创建下面的图表:
提问于 2022-09-04 18:07:00
我有以下两个数据:
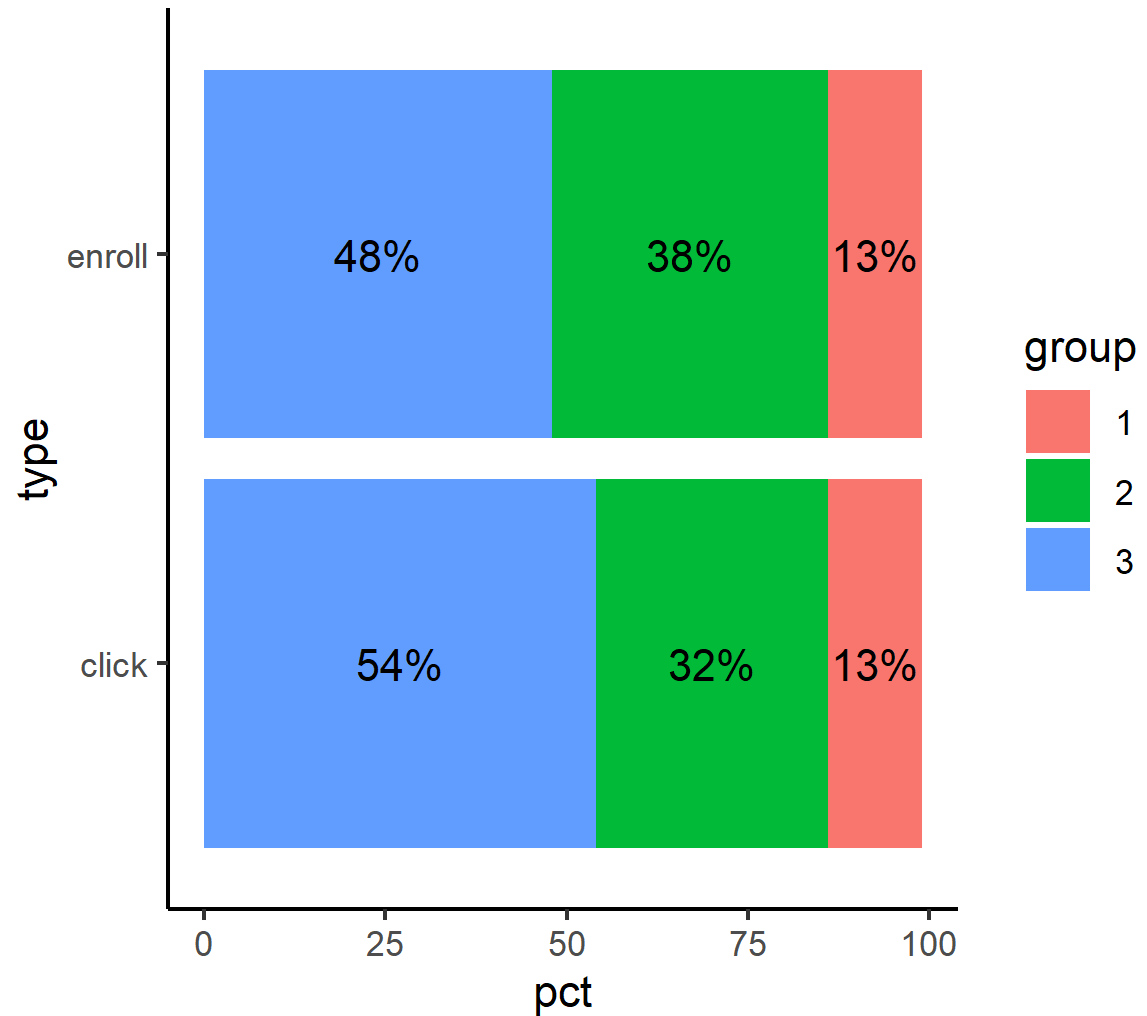
lc2 <- structure(list(group = 1:3, sumpct = c(13, 32, 54)), class = "data.frame", row.names = c(NA,
-3L))
注这是“可能单击”栏(见图),其中“极/有点可能”为13%,中性为32,极/不可能为54)。
和
le2 <- structure(list(e = 1:3, t = c(13, 38, 48)), class = "data.frame", row.names = c(NA,
-3L))
注意,同样,上面的代码是下面“可能注册”栏的代码。
但我想要创造这个:

回答 1
Stack Overflow用户
回答已采纳
发布于 2022-09-04 18:39:45
lc2 <- structure(list(group = 1:3, sumpct = c(13, 32, 54)),
                 class = "data.frame", row.names = c(NA, -3L))
le2 <- structure(list(e = 1:3, t = c(13, 38, 48)),
                 class = "data.frame", row.names = c(NA, -3L))


lc2$type <- "click"
le2$type <- "enroll"

colnames(lc2) <- c("group", "pct", "type")
colnames(le2) <- c("group", "pct", "type")

library(data.table)
library(ggplot2)
dt <- rbindlist(list(lc2, le2))
dt[, group := as.factor(group)]
ggplot(dt, aes(x = type, y = pct, fill = group)) +
  geom_bar(stat = "identity") +
  geom_text(aes(label=scales::percent(pct/100)), position = position_stack(vjust = .5))+
  theme_classic() +
  coord_flip()
页面原文内容由Stack Overflow提供。腾讯云小微IT领域专用引擎提供翻译支持
原文链接:
https://stackoverflow.com/questions/73601715
复制相关文章
相似问题
腾讯云开发者

Copyright © 2013 - 2026 Tencent Cloud. All Rights Reserved. 腾讯云 版权所有
深圳市腾讯计算机系统有限公司 ICP备案/许可证号:粤B2-20090059 ![]() 粤公网安备44030502008569号
粤公网安备44030502008569号
腾讯云计算(北京)有限责任公司 京ICP证150476号 | 京ICP备11018762号