
Euler方法python
Euler方法python
提问于 2022-09-01 14:20:58
我在情节上有些问题。这里的Exatlct解是正确的,但是eulerbmethod给出了同样的曲线,但要低得多。
import numpy as np
import matplotlib.pyplot as plt

# Define parameters
f = lambda x, y: 2*x
h = 0.1
x = np.arange(-10, 10, h)
x0 = 0
y0 = 2

# Explicit Euler Method
y = np.zeros(len(x))
y[x0] = y0

for i in range(0, len(x) - 1):
    y[i + 1] = y[i] + h*f(x[i], y[i])

plt.figure(figsize=(12, 8))
plt.plot(x, y, 'b--', label='Euler')
plt.plot(x, 2+x**2, 'g', label='Exact')
plt.title('Numerical integration methods')
plt.xlabel('x')
plt.ylabel('y')
plt.grid()
plt.legend()
plt.show()回答 1
Stack Overflow用户
发布于 2022-09-01 15:20:29
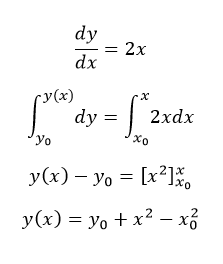
那是因为你的“精确解决方案”不正确。集成时,必须考虑x的非零值:
页面原文内容由Stack Overflow提供。腾讯云小微IT领域专用引擎提供翻译支持
原文链接:
https://stackoverflow.com/questions/73570944
复制相关文章
相似问题
腾讯云开发者

Copyright © 2013 - 2026 Tencent Cloud. All Rights Reserved. 腾讯云 版权所有
深圳市腾讯计算机系统有限公司 ICP备案/许可证号:粤B2-20090059 ![]() 粤公网安备44030502008569号
粤公网安备44030502008569号
腾讯云计算(北京)有限责任公司 京ICP证150476号 | 京ICP备11018762号