
平顶山热图
平顶山热图
提问于 2022-08-31 06:46:58
我一直在使用Pandas .corr()和Seaborn一起生成显示关联的热图,但是我想切换到using的.rcorr()来提供更多的控制。
import pandas as pd
import numpy as np
import seaborn as sns
import matplotlib.pyplot as plt
import pingouin as pg


df_correlation = df.rcorr(method='spearman')
这提供了一个与下面类似的df (直接取自Pingouin文档作为一个例子)。
    Neuroticism Extraversion Openness Agreeableness
Neuroticism             -          ***                     **
Extraversion        -0.35            -      ***
Openness            -0.01        0.265        -           ***
Agreeableness      -0.134        0.054    0.161             -
在使用Pandas .corr()时,我能够直接使用Seaborn绘制堆图,然后屏蔽上面的对角线,但由于***的存在,这是行不通的。
我正在寻找一种方法来绘制这张平望派生的数据作为一个热图,只取数字(但是如果*可以包含在上象限中的话)。
我目前对此的“修正”是使用一系列.replace()修改来更改'-‘用于'1’等,但这似乎不是一个很好的解决方案
df_correlation.replace(['-'], 1)回答 1
Stack Overflow用户
回答已采纳
发布于 2022-08-31 07:50:41
你可以这样做:
import numpy as np
import pandas as pd
import pingouin as pg
import seaborn as sns
import matplotlib.pyplot as plt
sns.set_theme() # or leave out for white background '***' and empty fields
# https://pingouin-stats.org/generated/pingouin.rcorr.html#pingouin.rcorr
df = pg.read_dataset('pairwise_corr').iloc[:, 1:]
df_correlation = df.rcorr(method='spearman')
df_correlation = df_correlation.replace('-','1.0')
# create mask (see source below in answer)
mask = np.zeros_like(df_correlation, dtype=bool)
mask[np.tril_indices_from(mask)] = True
# apply mask, and set type to float
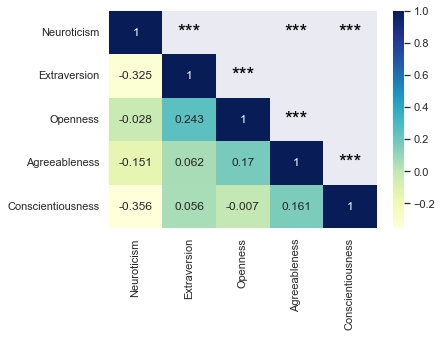
ax = sns.heatmap(df_correlation.where(mask).astype(float),
annot=True, fmt="g", cmap='YlGnBu')
# invert mask for the labels ('***' vals)
labels = df_correlation.where(~mask).to_numpy()
# add individual labels using `ax.text` (see source below in answer)
for (j,i), label in np.ndenumerate(labels):
if isinstance(label,str):
ax.text(i+0.5, j+0.5, label,
fontdict=dict(ha='center', va='center',
color='black', fontsize=20))
plt.show()结果:
因此资料来源:
关于生成掩码的Python generate a mask for the lower triangle of a matrix.
- On
页面原文内容由Stack Overflow提供。腾讯云小微IT领域专用引擎提供翻译支持
原文链接:
https://stackoverflow.com/questions/73551856
复制相关文章
相似问题
腾讯云开发者

Copyright © 2013 - 2026 Tencent Cloud. All Rights Reserved. 腾讯云 版权所有
深圳市腾讯计算机系统有限公司 ICP备案/许可证号:粤B2-20090059 ![]() 粤公网安备44030502008569号
粤公网安备44030502008569号
腾讯云计算(北京)有限责任公司 京ICP证150476号 | 京ICP备11018762号