
如何在r射线渲染器中添加多边形到三维地图中?
如何在r射线渲染器中添加多边形到三维地图中?
提问于 2022-08-27 12:07:10
我是地理空间数据的新手,我只是通过查看web上的几篇文章,设法将其绘制成一些小片段。
我试图在使用rayshader包构建的3D绘图上绘制多边形边界,但是面对plot,而在顶部显示多边形边界E 211。
使用的形状文件是2011_Dist.shp,可以从Shapefile Github链接下载。
我尝试过的代码:
library(tidyverse)
library(sf)
library(elevatr)
library(raster)
library(rayshader)
library(osmdata)# read districts shape file
ind_distirct_shp <- sf::st_read("local path/2011_Dist.shp")
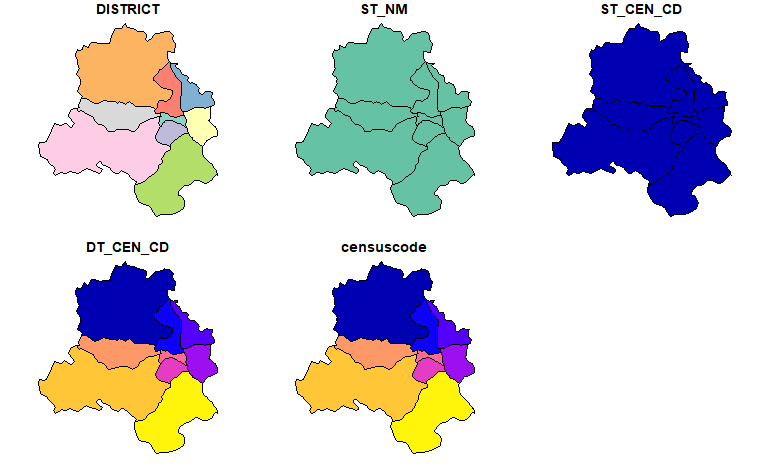
ind_distirct_shp# filter State
delhi_district_shp <- ind_distirct_shp %>%
sf::st_as_sf() %>%
filter(ST_NM %in% c("NCT of Delhi"))# this shows the polygon boundaries that I need on top of map
plot(delhi_district_shp)
# download elevation data for State Delhi
delhi_raster <- elevatr::get_elev_raster(delhi_district_shp, z = 10, clip = "location")# convert to matrix
delhi_mat <- raster_to_matrix(delhi_raster)# 3D plot using Rayshader
delhi_mat %>%
height_shade(texture = grDevices::colorRampPalette(c("#9a133d","orange","red","purple"
))(256)) %>%
plot_3d(heightmap = delhi_mat,
windowsize = c(800,800), # c(800*wr,800*hr)
solid = FALSE,
zscale = 1,
phi = 90,
zoom = .6,
theta = 0,
shadowcolor = "grey50",
linewidth = 6,
background = "white",
solidlinecolor = "#013b39")
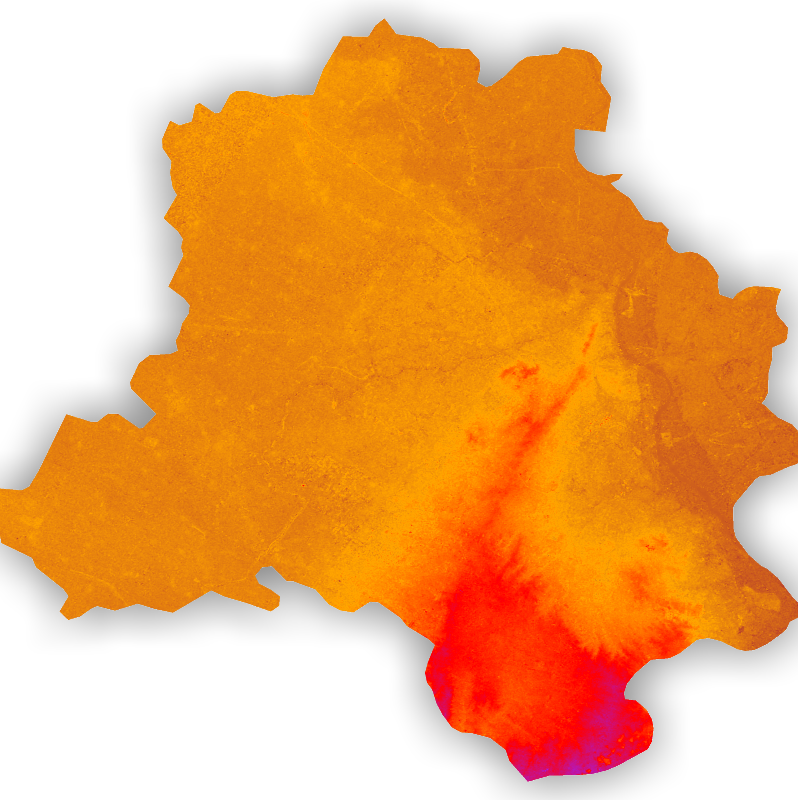
问题:现在当我试图修改这个以添加polygon lines时,它不起作用。
polygon_layer = generate_polygon_overlay(delhi_district_shp, extent = extent(delhi_raster),
                                    heightmap = delhi_mat) # , palette="grey30"

polygon_layerdelhi_mat %>%
height_shade(texture = grDevices::colorRampPalette(c("#9a133d","orange","red","purple"
))(256)) %>%
add_overlay(polygon_layer) %>%
plot_3d(heightmap = delhi_mat,
windowsize = c(800,800), # c(800*wr,800*hr)
solid = FALSE,
zscale = 1,
phi = 90,
zoom = .6,
theta = 0,
shadowcolor = "grey50",
linewidth = 6,
background = "white",
solidlinecolor = "#013b39")
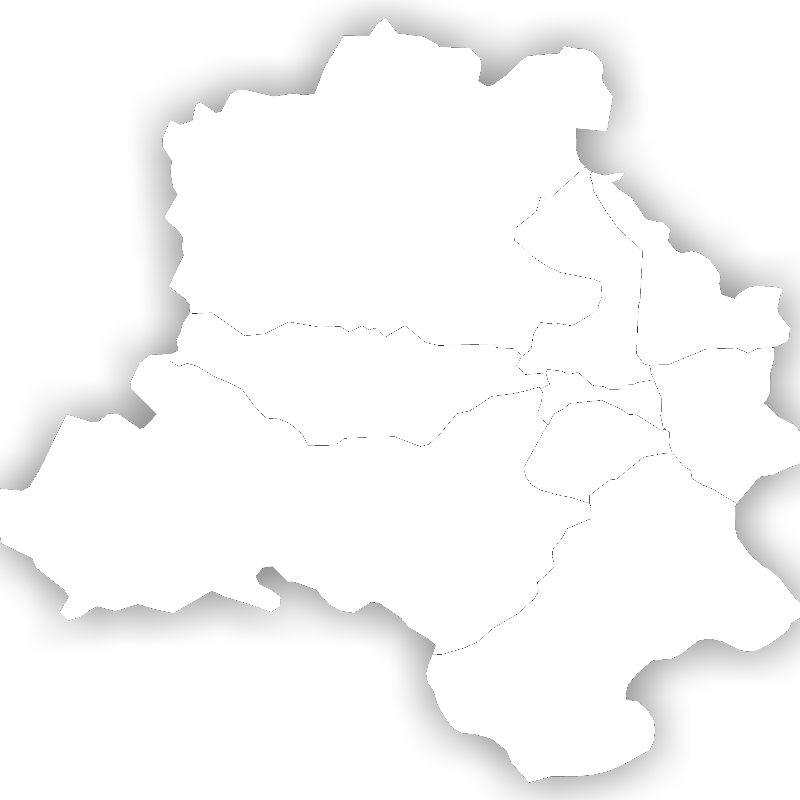
它应该是多角形线之上的橙色3D地图,但它没有工作,如我所预期的。
- 我还试过使用Rayshder的泰勒网站示例https://www.tylermw.com/adding-open-street-map-data-to-rayshader-maps-in-r/
library(osmdata)

osm_bbox = c(extent(delhi_raster)[3],extent(delhi_raster)[1],extent(delhi_raster)[4],extent(delhi_raster)[2])
osm_bboxraster_polygon_boundary <- osmdata::opq(osm_bbox) %>%
add_osm_feature("highway") %>% # "admin_level"
osmdata_sf()
raster_polygon_boundary输出:
Object of class 'osmdata' with:
                 $bbox : 76.8425681832661,28.4030759258059,77.347719586084,28.8793200072187
        $overpass_call : The call submitted to the overpass API
                 $meta : metadata including timestamp and version numbers
           $osm_points : 'sf' Simple Features Collection with 0 points
            $osm_lines : NULL
         $osm_polygons : 'sf' Simple Features Collection with 0 polygons
       $osm_multilines : NULL
$osm_multipolygons : NULL我得到了0多边形和线以上,所以我不能添加任何polygon之上的3D绘图。
我该怎么解决这个问题。感谢你的帮助。
回答 1
Stack Overflow用户
发布于 2022-08-27 12:56:46
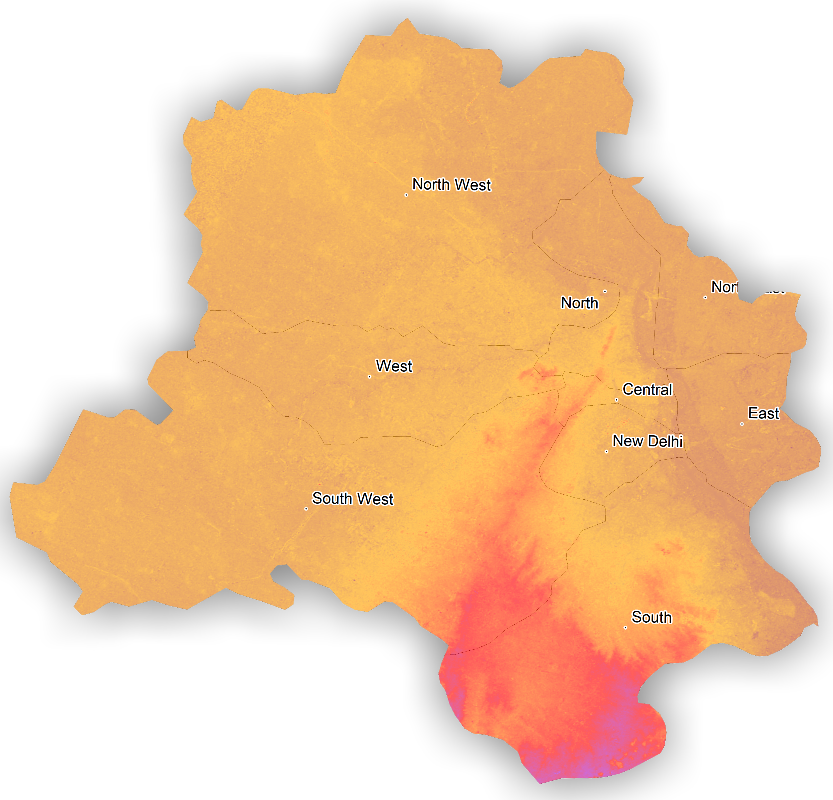
将alphalayer添加到add_overlay(polygon_layer,alphalayer = .6)中是有帮助的,尽管它起了作用,但透明度仍然不能很好地工作。它在情节中造成了一些whiteness。如果其他人有更好的答案或改进方法,请随意分享。
delhi_mat %>%

  height_shade(texture = grDevices::colorRampPalette(c("#9a133d","orange","red","purple"
                                                       ))(256)) %>%
  add_overlay(polygon_layer,alphalayer = .6) %>%

  add_overlay(generate_label_overlay(delhi_district_shp, extent = extent(delhi_raster),
                                     text_size = 5, point_size = 1,
                                     halo_color = "white",halo_expand = 5,
                                     seed=1,
                                     heightmap = delhi_mat, data_label_column = "DISTRICT")) %>%

  plot_3d(heightmap = delhi_mat,
          windowsize = c(800,800), # c(800*wr,800*hr)
          solid = FALSE,
          zscale = .7,
          phi = 90,
          zoom = .6,
          theta = 0,
          shadowcolor = "grey50",
          linewidth = 6,
          background = "white",
          solidlinecolor = "#013b39")
页面原文内容由Stack Overflow提供。腾讯云小微IT领域专用引擎提供翻译支持
原文链接:
https://stackoverflow.com/questions/73510860
复制相关文章
相似问题
腾讯云开发者

Copyright © 2013 - 2026 Tencent Cloud. All Rights Reserved. 腾讯云 版权所有
深圳市腾讯计算机系统有限公司 ICP备案/许可证号:粤B2-20090059 ![]() 粤公网安备44030502008569号
粤公网安备44030502008569号
腾讯云计算(北京)有限责任公司 京ICP证150476号 | 京ICP备11018762号