
如何创建精确召回曲线来比较Python中的两个分类器?
如何创建精确召回曲线来比较Python中的两个分类器?
提问于 2022-08-18 02:01:33
我的目标是找出查全率-回忆曲线,并与Logistic回归和随机森林进行比较,并绘制成一个图。我想知道我是否使用了正确的步骤来创建一个图来比较这两个分类器。我很感激你的帮助!
代码:
from sklearn.preprocessing import MultiLabelBinarizer as mlb
import numpy as np
import pandas as pd
from sklearn.linear_model import LogisticRegression
from sklearn.metrics import confusion_matrix
from sklearn.metrics import classification_report
from sklearn.datasets import make_classification
from sklearn import metrics
from sklearn.linear_model import LogisticRegression
from sklearn.ensemble import RandomForestClassifier
from sklearn.model_selection import train_test_split
from sklearn.metrics import precision_recall_curve
from sklearn.metrics import f1_score
from sklearn.metrics import auc
from matplotlib import pyplot
X = df[["DIAGNOSIS_CD_Dummy"]]
y = df[["TEST_RESULT_Dummy"]]
# X = pd.DataFrame(df.iloc[:, -1])
# y = pd.DataFrame(df.iloc[:, :-1])
# raw confusion matrix
df = pd.DataFrame(df, columns=["DIAGNOSIS_CD_Dummy", "TEST_RESULT_Dummy"])
confusion_matrix = pd.crosstab(
df["TEST_RESULT_Dummy"],
df["DIAGNOSIS_CD_Dummy"],
rownames=["Test Result"],
colnames=["Diagnosis"],
)
print(confusion_matrix)
# Logistic Regression Confusion Matrix
from sklearn.preprocessing import MultiLabelBinarizer as mlb
import numpy as np
import pandas as pd
from sklearn.linear_model import LogisticRegression
from sklearn.metrics import confusion_matrix
from sklearn.metrics import classification_report
from sklearn.datasets import make_classification
from sklearn import metrics
# split into training and test using scikit
from sklearn.model_selection import train_test_split
X_train, X_test, y_train, y_test = train_test_split(
X, y.values.ravel(), test_size=0.3, random_state=1, stratify=y
)
log_model = LogisticRegression()
log_model.fit(X_train, y_train)
# use logistic regression model to make predictions
y_score = log_model.predict_proba(X_test)[:, 1]
y_pred = log_model.predict(X_test)
y_pred = np.round(y_pred)
confusion_matrix = confusion_matrix(y_test, y_pred)
print("\n")
print(confusion_matrix)
print("\n")
print(classification_report(y_test, y_pred, zero_division=0))
# calculate precision and recall
precision, recall, thresholds = precision_recall_curve(y_test, y_score)
# create precision recall curve
fig, ax = plt.subplots()
ax.plot(recall, precision, color="purple")
# add axis labels to plot
ax.set_title("Precision-Recall Curve")
ax.set_ylabel("Precision")
ax.set_xlabel("Recall")
# display plot
plt.show()
# precision-recall curve
# generate 2 class dataset
X = df[["DIAGNOSIS_CD_Dummy"]]
y = df[["TEST_RESULT_Dummy"]]
# X = pd.DataFrame(df.iloc[:, :-1])
# y = pd.DataFrame(df.iloc[:, -1])
# split into train/test sets
trainX, testX, trainy, testy = train_test_split(
X, y.values.ravel(), test_size=0.3, random_state=2
)
# fit a model
model = LogisticRegression(solver="lbfgs")
model.fit(trainX, trainy)
# predict probabilities
lr_probs = model.predict_proba(testX)
# probs_rf = model_rf.predict_proba(testX)[:, 1]
# keep probabilities for the positive outcome only
lr_probs = lr_probs[:, 1]
# predict class values
yhat = model.predict(testX)
lr_precision, lr_recall, _ = precision_recall_curve(testy, lr_probs)
lr_f1, lr_auc = f1_score(testy, yhat), auc(lr_recall, lr_precision)
# precision_rf, recall_rf, _ = precision_recall_curve(testy, probs_rf)
# f1_rf, auc_rf = f1_score(testy, yhat), auc(recall_rf, precision_rf)
# auc_rf = auc(recall_rf, precision_rf)
# summarize scores
print("Logistic: f1=%.3f auc=%.3f" % (lr_f1, lr_auc))
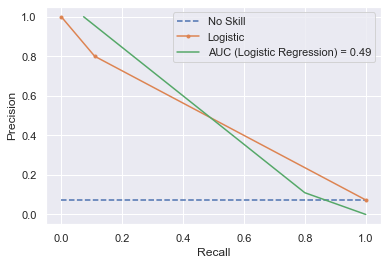
# plot the precision-recall curves
no_skill = len(testy[testy == 1]) / len(testy)
pyplot.plot([0, 1], [no_skill, no_skill], linestyle="--", label="No Skill")
pyplot.plot(lr_recall, lr_precision, marker=".", label="Logistic")
plt.plot(lr_precision, lr_recall, label=f"AUC (Logistic Regression) = {lr_auc:.2f}")
# axis labels
pyplot.xlabel("Recall")
pyplot.ylabel("Precision")
# show the legend
pyplot.legend()
# show the plot
pyplot.show()
# Random Forest
model_rf = RandomForestClassifier()
model_rf.fit(trainX, trainy)
# model_rf = RandomForestClassifier().fit(trainX, trainy)
# predict probabilities
lr_probs = model.predict_proba(testX)
probs_rf = model_rf.predict_proba(testX)
# keep probabilities for the positive outcome only
probs_rf = probs_rf[:, 1]
# predict class values
yhat = model.predict(testX)
precision_rf, recall_rf, _ = precision_recall_curve(testy, probs_rf)
f1_rf, auc_rf = f1_score(testy, yhat), auc(recall_rf, precision_rf)
auc_rf = auc(recall_rf, precision_rf)
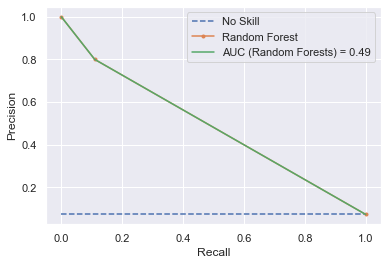
print("Random Forest: f1=%.3f auc=%.3f" % (f1_rf, auc_rf))
# plot the precision-recall curves
no_skill = len(testy[testy == 1]) / len(testy)
pyplot.plot([0, 1], [no_skill, no_skill], linestyle="--", label="No Skill")
pyplot.plot(lr_recall, lr_precision, marker=".", label="Random Forest")
plt.plot(recall_rf, precision_rf, label=f"AUC (Random Forests) = {auc_rf:.2f}")
# axis labels
pyplot.xlabel("Recall")
pyplot.ylabel("Precision")
# show the legend
pyplot.legend()
# show the plot
pyplot.show()输出:
Diagnosis        0    1
Test Result
0            18385   32
1             1268  165


[[5514   11]
 [ 374   56]]


              precision    recall  f1-score   support

           0       0.94      1.00      0.97      5525
           1       0.84      0.13      0.23       430

    accuracy                           0.94      5955
   macro avg       0.89      0.56      0.60      5955
weighted avg       0.93      0.94      0.91      5955
后勤: f1=0.193 auc=0.488
随机森林: f1=0.193 auc=0.488
回答 1
Stack Overflow用户
发布于 2022-10-29 19:43:18
这是我的图谋。
import pathlib
import numpy as np
import matplotlib.pyplot as plt
from matplotlib.ticker import (MultipleLocator, AutoMinorLocator)
from sklearn.metrics import PrecisionRecallDisplay
from sklearn.multiclass import OneVsRestClassifier
from sklearn.metrics import precision_recall_curve
from sklearn.metrics import average_precision_score
from itertools import cycle
from imblearn.pipeline import Pipeline
from sklearn.preprocessing import label_binarize
def __plot_binary_precision_recall_curve(X_test, y_test, *args, **kwargs):
"""
Private function to be used by plot_precision_recall_curve for binary applications.
"""
if 'fig_size' in kwargs and 'dpi' in kwargs:
fig, ax = plt.subplots(figsize=kwargs['fig_size'], dpi=kwargs['dpi'])
else:
fig, ax = plt.subplots()
plt.rcParams["figure.facecolor"] = 'white'
plt.rcParams["axes.facecolor"] = 'white'
plt.rcParams["savefig.facecolor"] = 'white'
ax.xaxis.set_major_locator(MultipleLocator(0.1))
ax.xaxis.set_major_formatter('{x:.1f}')
ax.yaxis.set_major_locator(MultipleLocator(0.1))
ax.yaxis.set_major_formatter('{x:.1f}')
ax.xaxis.set_minor_locator(MultipleLocator(0.05))
ax.yaxis.set_minor_locator(MultipleLocator(0.05))
ax.tick_params(which='both', width=2)
ax.tick_params(which='major', length=7)
ax.tick_params(which='minor', length=4, color='black')
plt.grid(True, zorder=0)
plt.plot([0, 1], [1, 0], linestyle='--', lw=1, color='k',
label='Luck', alpha=.8, zorder=1) # random prediction curve
plt.plot([1, 1], [1, 0], c='k', linestyle='dashdot'), plt.plot([1, 1], c='k', linestyle='dashdot', zorder=2, label="Perfect model") #perfect model prediction curve
f_scores = np.linspace(0.2, 0.8, num=4)
lines, labels = [], []
for f_score in f_scores:
x = np.linspace(0.01, 1)
y = f_score * x / (2 * x - f_score)
(l,) = plt.plot(x[y >= 0], y[y >= 0], color="gray", alpha=0.2)
plt.annotate("f1={0:0.1f}".format(f_score), xy=(0.9, y[45] + 0.02))
zorder = 3
for classifier in args:
display = PrecisionRecallDisplay.from_estimator(classifier, X_test, y_test, ax=ax, zorder=zorder)
zorder +=1
# add the legend for the iso-f1 curves
handles, labels = display.ax_.get_legend_handles_labels()
handles.extend([l])
labels.extend(["iso-f1 curves"])
# set the legend and the axes
ax.set_xlim([0.0, 1.0])
ax.set_ylim([0.0, 1.05])
ax.legend(handles=handles, labels=labels, loc="best")
plt.xlabel('Recall', fontsize=18)
plt.ylabel('Precision', fontsize=18)
if 'title' in kwargs:
ax.set_title(kwargs['title'], fontsize=18)
else:
ax.set_title("Precision-Recall Curve", fontsize=18)
if 'save_fig_path' in kwargs:
path = pathlib.Path(kwargs['save_fig_path'])
path.parent.mkdir(parents=True, exist_ok=True)
fig.savefig(kwargs['save_fig_path'], dpi=kwargs['dpi'], facecolor=fig.get_facecolor(), edgecolor='none')
return fig, ax
def __plot_multiclass_precision_recall_curve(X_train, y_train, X_test, y_test, *args, **kwargs):
"""
Private function designed to be used by plot_precision_recall_curve for multiclass applications.
"""
my_vals = y_test.unique().tolist()
my_vals.sort()
# binarize the y_test series
y_test = label_binarize(y_test, classes=my_vals)
n_classes = y_test.shape[1]
# setup plot details
colors = cycle(["navy", "turquoise", "darkorange", "cornflowerblue", "teal"])
if 'fig_size' in kwargs and 'dpi' in kwargs:
fig, ax = plt.subplots(len(args), figsize=kwargs['fig_size'], dpi=kwargs['dpi'], facecolor='white')
else:
fig, ax = plt.subplots(len(args), facecolor='white')
for count, clfs in enumerate(args):
ax[count].xaxis.set_major_locator(MultipleLocator(0.1))
ax[count].xaxis.set_major_formatter('{x:.1f}')
ax[count].yaxis.set_major_locator(MultipleLocator(0.1))
ax[count].yaxis.set_major_formatter('{x:.1f}')
ax[count].xaxis.set_minor_locator(MultipleLocator(0.05))
ax[count].yaxis.set_minor_locator(MultipleLocator(0.05))
ax[count].tick_params(which='both', width=2)
ax[count].tick_params(which='major', length=7)
ax[count].tick_params(which='minor', length=4, color='black')
ax[count].grid(True, zorder=0)
ax[count].plot([0, 1], [1, 0], linestyle='--', lw=1, color='k',
label='Luck', alpha=.8, zorder=1) # random prediction curve
ax[count].plot([1, 1], [1, 0], c='k', linestyle='dashdot'), ax[count].plot([1, 1], c='k', linestyle='dashdot', zorder=2, label="Perfect model") #perfect model prediction curve
# set up the model, wrapped by the OneVsRestClassifier
classifier = OneVsRestClassifier(clfs)
classifier.fit(X_train, y_train) # train the model
# produce the predictions (as probabilities)
y_score = classifier.predict_proba(X_test)
# For each class
precision = dict()
recall = dict()
average_precision = dict()
for i in range(n_classes):
precision[i], recall[i], _ = precision_recall_curve(y_test[:, i], y_score[:, i])
average_precision[i] = average_precision_score(y_test[:, i], y_score[:, i])
# A "micro-average": quantifying score on all classes jointly
precision["micro"], recall["micro"], _ = precision_recall_curve(
y_test.ravel(), y_score.ravel()
)
average_precision["micro"] = average_precision_score(y_test, y_score, average="micro")
f_scores = np.linspace(0.2, 0.8, num=4)
lines, labels = [], []
for f_score in f_scores:
x = np.linspace(0.01, 1)
y = f_score * x / (2 * x - f_score)
(l,) = ax[count].plot(x[y >= 0], y[y >= 0], color="gray", alpha=0.2)
ax[count].annotate("f1={0:0.1f}".format(f_score), xy=(0.9, y[45] + 0.02))
display = PrecisionRecallDisplay(
recall=recall["micro"],
precision=precision["micro"],
average_precision=average_precision["micro"],
)
display.plot(ax=ax[count], name="Micro-average precision-recall", color="gold")
for i, color in zip(range(n_classes), colors):
display = PrecisionRecallDisplay(
recall=recall[i],
precision=precision[i],
average_precision=average_precision[i],
)
display.plot(ax=ax[count], name=f"Precision-recall for class {i}", color=color)
# add the legend for the iso-f1 curves
handles, labels = display.ax_.get_legend_handles_labels()
handles.extend([l])
labels.extend(["iso-f1 curves"])
# set the legend and the axes
ax[count].set_xlim([0.0, 1.0])
ax[count].set_ylim([0.0, 1.05])
ax[count].legend(handles=handles, labels=labels, loc="best")
if type(clfs) == Pipeline:
estimator_name = str(type(clfs['clf'])).split(".")[-1][:-2]
else:
estimator_name = str(type(clfs)).split(".")[-1][:-2]
if 'title' in kwargs:
ax[count].set_title(kwargs['title'] + " - " + estimator_name, fontsize=18)
else:
ax[count].set_title("Precision-Recall Curve" + " - " + estimator_name, fontsize=18)
ax[count].set_xlabel('Recall', fontsize=18)
ax[count].set_ylabel('Precision', fontsize=18)
if 'save_fig_path' in kwargs:
path = pathlib.Path(kwargs['save_fig_path'])
path.parent.mkdir(parents=True, exist_ok=True)
fig.savefig(kwargs['save_fig_path'], dpi=kwargs['dpi'], facecolor=fig.get_facecolor(), edgecolor='none')
return fig, ax
def plot_precision_recall_curve(X_train, y_train, X_test, y_test, *args, **kwargs):
"""
Plots precision recall curves for the given models
Parameters
----------
X_test : pandas.DataFrame of shape (n_samples, n_features)
Test values.
y_test : pandas.Series of shape (n_samples,)
Target values.
*args : estimators to plot precision and recall curves
estimator instance (either sklearn.Pipeline, imblearn.Pipeline or a classifier)
PRE-FITTED classifier or a PRE-FITTED Pipeline in which the last estimator is a classifier.
**kwargs : The following options are available with kwargs
fig_size : tuple
Size (inches) of the plot.
dpi : int, default = 100
Image DPI.
title : str
The title of the plot.
save_fig_path : str
Full path where to save the plot. Will generate the folders if they don't exist already.
Returns
-------
fig : Matplotlib.pyplot.Figure
Figure from matplotlib
ax : Matplotlib.pyplot.Axe
Axe object from matplotlib
Example Syntax
--------------
fig, ax = reporting.plot_precision_recall_curve(X_train, y_train, X_test, y_test,
rf_pipe, catboost_classifier,
fig_size=(10,16), dpi=100,
title="Precision-Recall Curve",
save_fig_path="dir1/dir2/precision_recall_curve.png")
"""
if (len(y_test.unique()) == 2):
fig, ax = __plot_binary_precision_recall_curve(X_test, y_test, *args, **kwargs)
else:
fig, ax = __plot_multiclass_precision_recall_curve(X_train, y_train, X_test, y_test, *args, **kwargs)
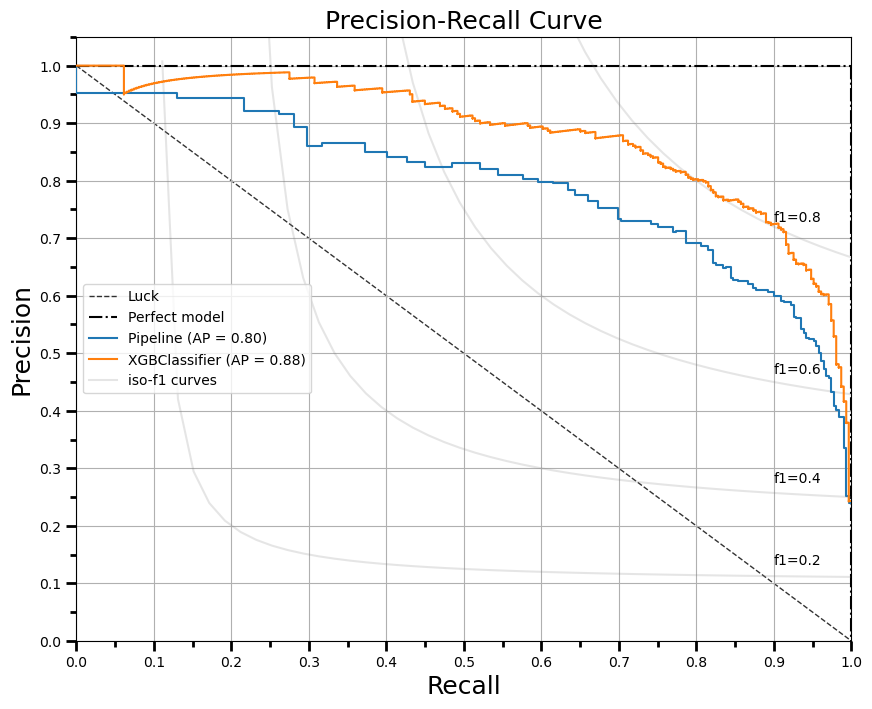
return fig, ax二进制Classification的
- 语法和输出
fig, ax = plot_precision_recall_curve(X_train, y_train, X_test, y_test,
               rf_pipe, xgboost_classifier,
               fig_size=(10,8), dpi=100,
               title="Precision-Recall Curve",
               save_fig_path="dir1/dir2/precision_recall_curve.png")
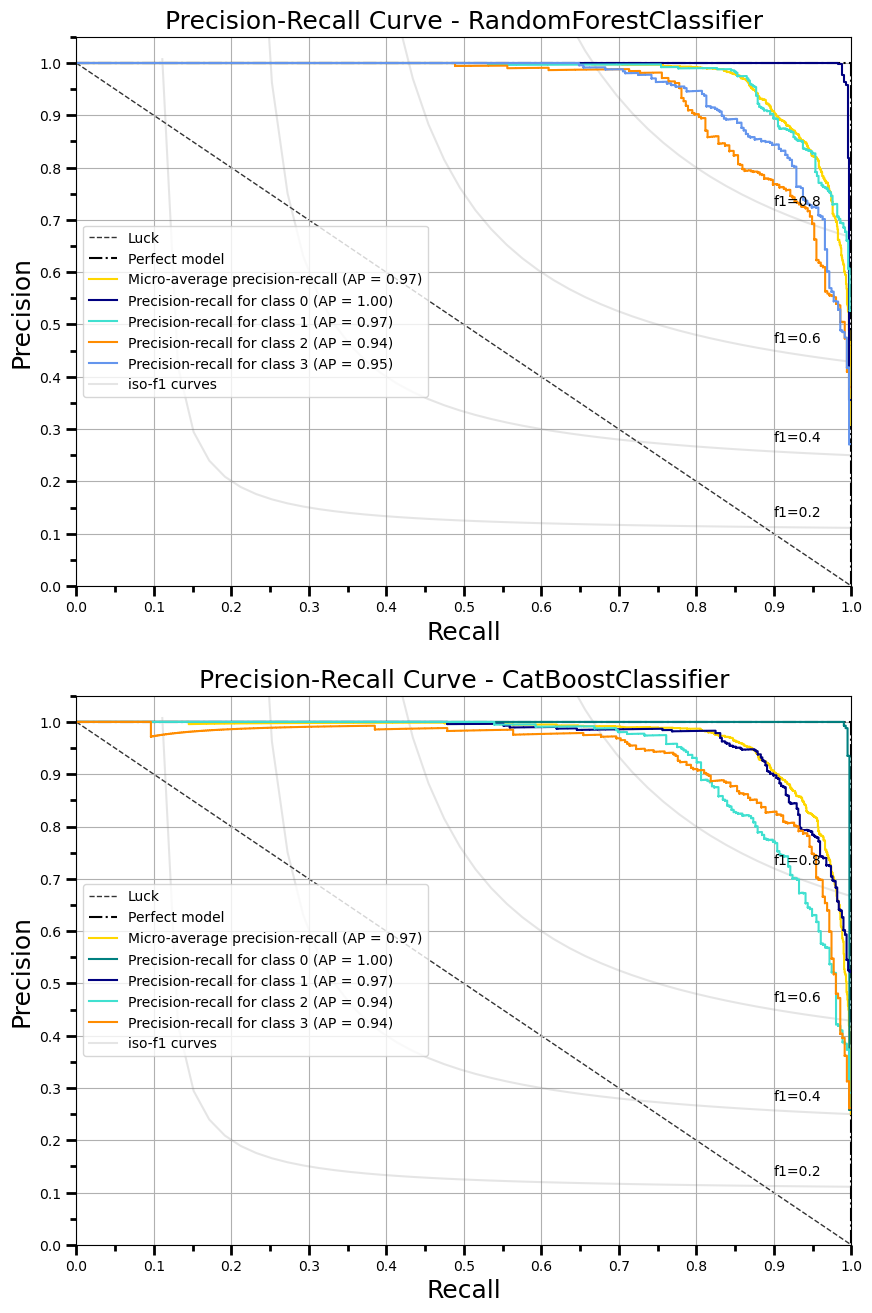
多类Classification的
- 语法及输出
fig, ax = plot_precision_recall_curve(X_train, y_train, X_test, y_test,
              rf_pipe, catboost_classifier,
              fig_size=(10,16), dpi=100,
              title="Precision-Recall Curve",
              save_fig_path="dir1/dir2/precision_recall_curve.png")
页面原文内容由Stack Overflow提供。腾讯云小微IT领域专用引擎提供翻译支持
原文链接:
https://stackoverflow.com/questions/73396647
复制相关文章
相似问题
腾讯云开发者

Copyright © 2013 - 2026 Tencent Cloud. All Rights Reserved. 腾讯云 版权所有
深圳市腾讯计算机系统有限公司 ICP备案/许可证号:粤B2-20090059 ![]() 粤公网安备44030502008569号
粤公网安备44030502008569号
腾讯云计算(北京)有限责任公司 京ICP证150476号 | 京ICP备11018762号