
当使用Cartopy (Python)绘制正交绘图时,如何裁剪地图/设置图像的纬度/经度边界?
当使用Cartopy (Python)绘制正交绘图时,如何裁剪地图/设置图像的纬度/经度边界?
提问于 2022-08-15 18:02:59
我正在绘制南极附近北极的正投影。然而,我想要裁剪这些图像,这样我只能看到极地的10或度范围内的纬度,而不是一直到赤道。到目前为止,我的代码如下:
# %% Import packages
import os
import matplotlib.pyplot as plt
import sys
import pandas as pd
import numpy as np
from geopack import geopack
import cartopy.crs as ccrs
import cartopy.feature as cfeature


fig = plt.figure(figsize=(20,10))

# North
ax = fig.add_subplot(1,2,1, projection=ccrs.Orthographic(central_latitude=90))
ax.stock_img()
ax.coastlines()
ax.add_feature(cfeature.BORDERS, linestyle="--")

# South
ax = fig.add_subplot(1,2,2, projection=ccrs.Orthographic(central_latitude=-90))
ax.stock_img()
ax.coastlines()
ax.add_feature(cfeature.BORDERS, linestyle="--")

plt.show() 
任何帮助都将不胜感激。谢谢!
回答 1
Stack Overflow用户
发布于 2022-08-16 06:53:09
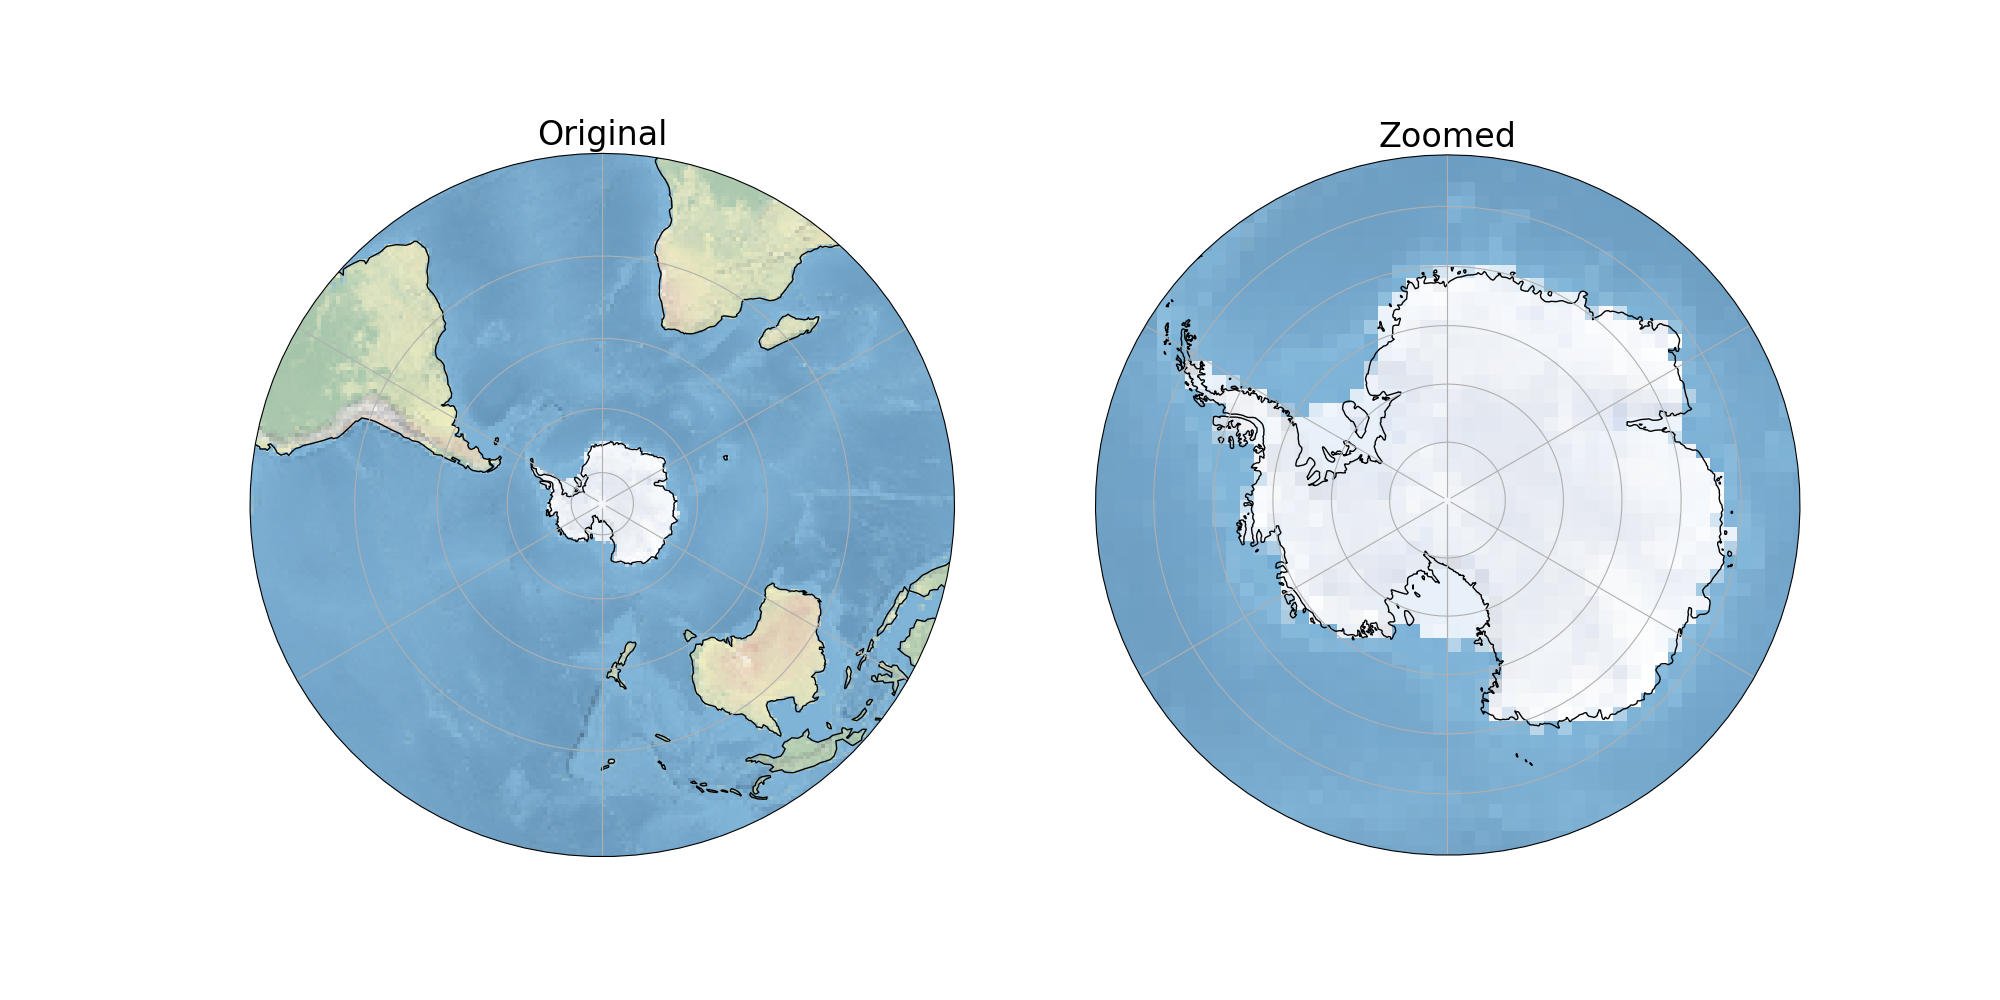
地图缩放可能不支持在Cartopy中的正投影。我尝试使用SouthNorthPolarStereo()投影,使用set_extent限制映射区域,并用循环路径裁剪绘图。输出可以满足您的要求。
这是密码。
# %% Import packages
#import os
import matplotlib.pyplot as plt
#import sys
#import pandas as pd
import numpy as np
#from geopack import geopack
import cartopy.crs as ccrs
import cartopy.feature as cfeature
import matplotlib.path as mpath

# ref: https://scitools.org.uk/cartopy/docs/latest/gallery/lines_and_polygons/always_circular_stereo.html#sphx-glr-gallery-lines-and-polygons-always-circular-stereo-py
def add_circle_boundary(ax):
    # Compute a circle in axes coordinates, which we can use as a boundary
    # for the map. We can pan/zoom as much as we like - the boundary will be
    # permanently circular.
    theta = np.linspace(0, 2*np.pi, 100)
    center, radius = [0.5, 0.5], 0.5
    verts = np.vstack([np.sin(theta), np.cos(theta)]).T
    circle = mpath.Path(verts * radius + center)
    ax.set_boundary(circle, transform=ax.transAxes)


fig = plt.figure(figsize=(20,10))
# South
#ax = fig.add_subplot(1,2,1, projection=ccrs.Orthographic(central_latitude=90))
#ax = fig.add_subplot(1,2,1, projection=ccrs.NorthPolarStereo())
ax = fig.add_subplot(1,2,1, projection=ccrs.SouthPolarStereo())
ax.stock_img()
ax.coastlines()
ax.gridlines()
ax.set_title('Original',fontsize = 24)
#ax.add_feature(cfeature.BORDERS, linestyle="--")
ax.set_extent([-180, 180, -90, 0], crs=ccrs.PlateCarree())
add_circle_boundary(ax)

# South zoomed
ax1 = fig.add_subplot(1,2,2, projection=ccrs.SouthPolarStereo())
ax1.stock_img()
ax1.coastlines()
ax1.gridlines()
#ax1.add_feature(cfeature.BORDERS, linestyle="--")
ax1.set_extent([-180, 180, -90, -60], crs=ccrs.PlateCarree())
ax1.set_title('Zoomed',fontsize = 24)
add_circle_boundary(ax1)

#plt.show()
plt.savefig("out.png")页面原文内容由Stack Overflow提供。腾讯云小微IT领域专用引擎提供翻译支持
原文链接:
https://stackoverflow.com/questions/73364801
复制相关文章
相似问题
腾讯云开发者

Copyright © 2013 - 2026 Tencent Cloud. All Rights Reserved. 腾讯云 版权所有
深圳市腾讯计算机系统有限公司 ICP备案/许可证号:粤B2-20090059 ![]() 粤公网安备44030502008569号
粤公网安备44030502008569号
腾讯云计算(北京)有限责任公司 京ICP证150476号 | 京ICP备11018762号