
机器学习变量重要性图
机器学习变量重要性图
提问于 2022-08-13 13:52:15
在机器学习中使用随机林子处理数据,使用caret和ranger软件包,通过varImp函数得到每个变量的重要性。
imp1<- varImp(RF,scale=FALSE)
imp1
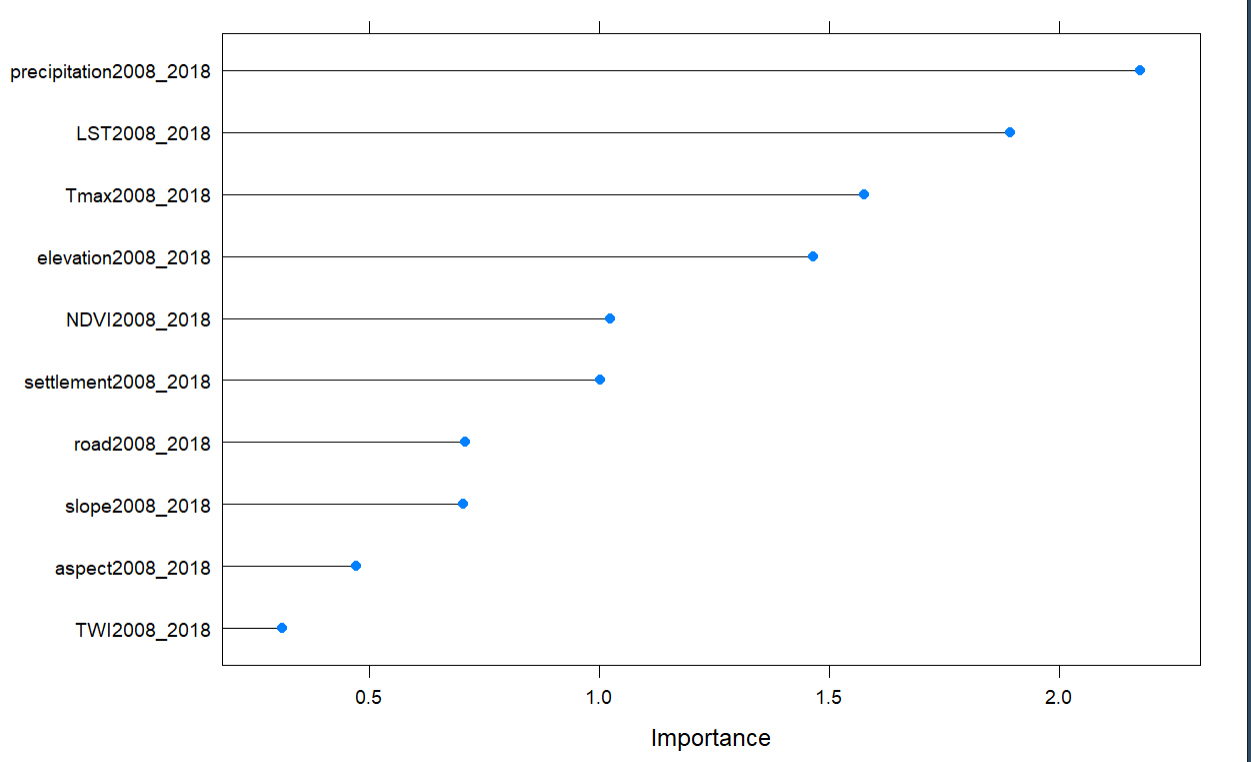
plot(imp1, top = 10)
> imp1
ranger variable importance
Overall
precipitation2008_2018 2.1755
LST2008_2018 1.8931
Tmax2008_2018 1.5757
elevation2008_2018 1.4642
NDVI2008_2018 1.0231
settlement2008_2018 1.0011
road2008_2018 0.7081
slope2008_2018 0.7047
aspect2008_2018 0.4721
TWI2008_2018 0.3114
因为我发现变量的重要性并不等于1,所以我使用了下面的代码来调整它。但是当我想用它来画一个图的时候,我发现它不能被画出来。
imp2 <- varImp(RF,scale=TRUE)[['importance']]
imp2$Overall <- imp2$Overall/sum(imp2$Overall)
imp2
plot(imp2 ,top=10)
> imp2
                          Overall
Tmax2008_2018          0.15389492
precipitation2008_2018 0.22691543
NDVI2008_2018          0.08663987
LST2008_2018           0.19253375
slope2008_2018         0.04787391
elevation2008_2018     0.14032420
aspect2008_2018        0.01956714
settlement2008_2018    0.08395931
road2008_2018          0.04829147
TWI2008_2018           0.00000000

> plot(imp2, top=10)
Warning messages:
1: In plot.window(xlim, ylim, log, ...) : "top" is not a graph parameter
2: In axis(side = side, at = at, labels = labels, ...) : "top" is not a graph parameter
3: In title(xlab = xlab, ylab = ylab, ...) : "top" is not a graph parameter
4: In plot.xy(xy.coords(x, y), type = type, ...) : "top" is not a figure parameter
我发现数据格式已经改变了。
str(imp1)
> str(imp1)
List of 3
 $ importance:'data.frame': 10 obs. of  1 variable:
  ..$ Overall: num [1:10] 1.576 2.176 1.023 1.893 0.705 ...
 $ model     : chr "ranger"
 $ calledFrom: chr "varImp"
 - attr(*, "class")= chr "varImp.train"

str(imp2)
> str(imp2)
'data.frame':   10 obs. of  1 variable:
 $ Overall: num  0.1539 0.2269 0.0866 0.1925 0.0479 ...

> dput(imp1)
structure(list(importance = structure(list(Overall = c(1.57565252079602,
2.17553558745997, 1.0231341483824, 1.89308085981913, 0.704661369152856,
1.46416539340723, 0.472113627124259, 1.00111266231049, 0.708091766750006,
0.31136434852237)), class = "data.frame", row.names = c("Tmax2008_2018",
"precipitation2008_2018", "NDVI2008_2018", "LST2008_2018", "slope2008_2018",
"elevation2008_2018", "aspect2008_2018", "settlement2008_2018",
"road2008_2018", "TWI2008_2018")), model = "ranger", calledFrom = "varImp"), class = "varImp.train")


> dput(imp2)
structure(list(Overall = c(0.153894924595083, 0.226915428412731,
0.0866398674611716, 0.192533750275507, 0.0478739077536024, 0.140324202793608,
0.0195671356037942, 0.0839593117043193, 0.048291471400184, 0)), row.names = c("Tmax2008_2018",
"precipitation2008_2018", "NDVI2008_2018", "LST2008_2018", "slope2008_2018",
"elevation2008_2018", "aspect2008_2018", "settlement2008_2018",
"road2008_2018", "TWI2008_2018"), class = "data.frame")
我想从imp2绘制一个与上面的imp1类似的变量重要性图。我怎么发动汽车呢?谢谢。
回答 1
Stack Overflow用户
回答已采纳
发布于 2022-08-13 14:40:14
您可以在imp1 dataframe中进行修改,因为它需要保留相同的varImp.train类。imp2是一个dataframe类,这就是它不再绘图的原因。您可以使用以下代码:
imp1 <- structure(list(importance = structure(list(Overall = c(1.57565252079602,
2.17553558745997, 1.0231341483824, 1.89308085981913, 0.704661369152856,
1.46416539340723, 0.472113627124259, 1.00111266231049, 0.708091766750006,
0.31136434852237)), class = "data.frame", row.names = c("Tmax2008_2018",
"precipitation2008_2018", "NDVI2008_2018", "LST2008_2018", "slope2008_2018",
"elevation2008_2018", "aspect2008_2018", "settlement2008_2018",
"road2008_2018", "TWI2008_2018")), model = "ranger", calledFrom = "varImp"), class = "varImp.train")
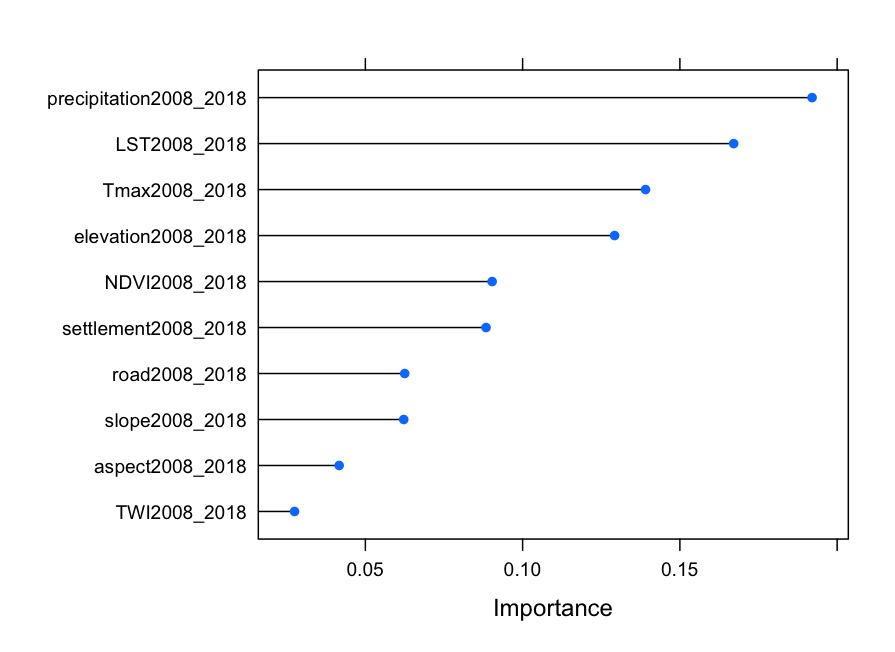
imp1$importance$Overall <- imp1$importance$Overall/sum(imp1$importance$Overall)
plot(imp1)输出:
页面原文内容由Stack Overflow提供。腾讯云小微IT领域专用引擎提供翻译支持
原文链接:
https://stackoverflow.com/questions/73344840
复制相关文章
相似问题
腾讯云开发者

Copyright © 2013 - 2026 Tencent Cloud. All Rights Reserved. 腾讯云 版权所有
深圳市腾讯计算机系统有限公司 ICP备案/许可证号:粤B2-20090059 ![]() 粤公网安备44030502008569号
粤公网安备44030502008569号
腾讯云计算(北京)有限责任公司 京ICP证150476号 | 京ICP备11018762号