
shap.TreeExplainer和shap.Explainer条形图的区别
对于下面给出的代码,我得到了shap值的不同条形图。
在本例中,我有一个包含1000个train样本的数据集,其中包含9个类和500个test样本。然后,我使用随机森林作为分类器并生成一个模型。当我开始生成shap条形图时,我在这两种方法中得到了不同的结果:
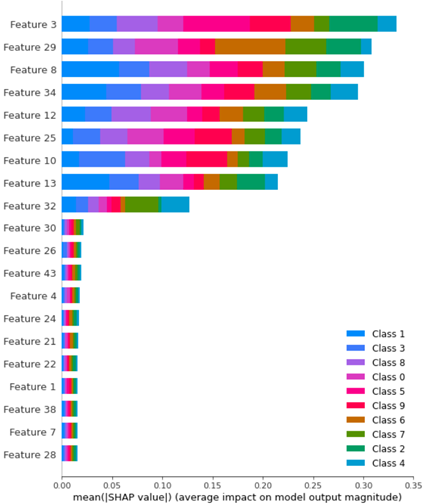
shap_values_Tree_tr = shap.TreeExplainer(clf.best_estimator_).shap_values(X_train)
shap.summary_plot(shap_values_Tree_tr, X_train)
然后:
explainer2 = shap.Explainer(clf.best_estimator_.predict, X_test)
shap_values = explainer2(X_test)
你能解释一下这两幅图有什么区别吗?feature importance用哪一幅?
这是我的代码:
from sklearn.datasets import make_classification
import seaborn as sns
import numpy as np
import pandas as pd
from matplotlib import pyplot as plt
import pickle
import joblib
import warnings
import shap
from sklearn.ensemble import RandomForestClassifier
from sklearn.model_selection import RandomizedSearchCV, GridSearchCV
f, (ax1,ax2) = plt.subplots(nrows=1, ncols=2,figsize=(20,8))
# Generate noisy Data
X_train,y_train = make_classification(n_samples=1000,
n_features=50,
n_informative=9,
n_redundant=0,
n_repeated=0,
n_classes=10,
n_clusters_per_class=1,
class_sep=9,
flip_y=0.2,
#weights=[0.5,0.5],
random_state=17)
X_test,y_test = make_classification(n_samples=500,
n_features=50,
n_informative=9,
n_redundant=0,
n_repeated=0,
n_classes=10,
n_clusters_per_class=1,
class_sep=9,
flip_y=0.2,
#weights=[0.5,0.5],
random_state=17)
model = RandomForestClassifier()
parameter_space = {
'n_estimators': [10,50,100],
'criterion': ['gini', 'entropy'],
'max_depth': np.linspace(10,50,11),
}
clf = GridSearchCV(model, parameter_space, cv = 5, scoring = "accuracy", verbose = True) # model
my_model = clf.fit(X_train,y_train)
print(f'Best Parameters: {clf.best_params_}')
# save the model to disk
filename = f'Testt-RF.sav'
pickle.dump(clf, open(filename, 'wb'))
shap_values_Tree_tr = shap.TreeExplainer(clf.best_estimator_).shap_values(X_train)
shap.summary_plot(shap_values_Tree_tr, X_train)
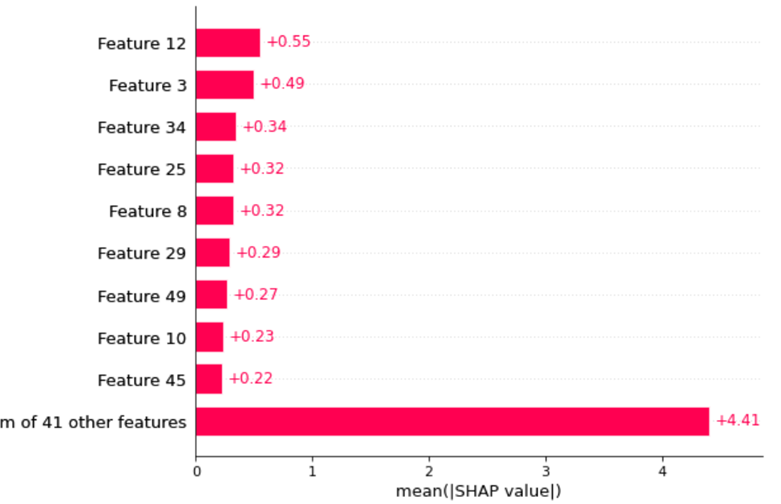
explainer2 = shap.Explainer(clf.best_estimator_.predict, X_test)
shap_values = explainer2(X_test)
shap.plots.bar(shap_values)谢谢你的帮助和时间!
回答 1
Stack Overflow用户
发布于 2022-08-14 09:31:00
您的代码有两个问题:
reproducible
- You似乎缺少了SHAP包中的一些重要概念,即哪些数据用于“训练”解释者(“对模型正确”或“对数据正确”),以及哪些数据用于预测SHAP值。
就第一本书而言,你可以在网上找到许多教程,甚至书籍。
关于第二个问题:
shap_values_Tree_tr = shap.TreeExplainer(clf.best_estimator_).shap_values(X_train)
shap.summary_plot(shap_values_Tree_tr, X_train)
与以下不同:
explainer2 = shap.Explainer(clf.best_estimator_.predict, X_test)
shap_values = explainer2(X_test)
因为:
values.
- Moreover,
- 首先使用经过训练的树进行预测;而第二次使用
X_test数据集来计算SHAP数据集(当您说
时)。
shap.Explainer(clf.best_estimator_.predict, X_test)我非常肯定,它不是用于培训您的解释程序的整个dataset X_test,而是它的100个数据点子集。
- ,
shap.TreeExplainer(clf.best_estimator_).shap_values(X_train)是不同的
explainer2(X_test)在第一种情况下,您是对X_train进行预测(和平均),而在第二种情况下,您是预测(和平均) X_test。在比较形状时,很容易确认这一点。
那么,如何调和两者呢?关于一个可复制的示例,请参见下面的内容:
1.进口、模型和数据,以便对解释者进行培训:
from sklearn.ensemble import RandomForestClassifier
from sklearn.datasets import make_classification
from sklearn.model_selection import train_test_split
from shap import maskers
from shap import TreeExplainer, Explainer

X, y = make_classification(1500, 10)
X_train, X_test, y_train, y_test = train_test_split(X, y, train_size=1000, random_state=42)

clf = RandomForestClassifier()
clf.fit(X_train, y_train)

background = maskers.Independent(X_train, 10) # data to train both explainers on
2.比较解释者:
exp = TreeExplainer(clf, background)
sv = exp.shap_values(X_test)

exp2 = Explainer(clf, background)
sv2 = exp2(X_test)

np.allclose(sv[0], sv2.values[:,:,0])True我也许应该从一开始就说明这一点:保证2显示相同的结果(如果使用正确),因为Explainer类是TreeExplainer的超集(当它看到树模型时使用后者)。
如果有什么不清楚的地方,请提出问题。
https://stackoverflow.com/questions/73329209
复制相似问题
腾讯云开发者

Copyright © 2013 - 2026 Tencent Cloud. All Rights Reserved. 腾讯云 版权所有
深圳市腾讯计算机系统有限公司 ICP备案/许可证号:粤B2-20090059 ![]() 粤公网安备44030502008569号
粤公网安备44030502008569号
腾讯云计算(北京)有限责任公司 京ICP证150476号 | 京ICP备11018762号