
na.rm不移除记录
na.rm不移除记录
提问于 2022-08-09 15:27:35
我不知道为什么ggplot()和geom_col()中的"na.rm=TRUE“不移除缺失的内容。下面是输入文件(代码中的文件名为dat.csv ):
br,tr,obs,ee,dd
UU,RRR,228,0.38895,0.33691
BB,RRR,591,0.37254,0.40899
GG,RRR,702,0.36163,0.38155
UU,AAA,229,0.31594,0.32768
BB,AAA,591,0.18185,0.23339
GG,AAA,702,0.37287,0.40218
UU,BBB,228,0.16561,0.32313
BB,BBB,591,0.22578,0.41145
GG,BBB,702,0.28103,0.46357
UU,LLL,1,.,.
UU,TTT,107,-0.01136,0.2265
BB,TTT,33,-0.34362,0.07749
GG,TTT,54,0.00905,-0.07037
这是代码
library("data.table")
library(conflicted)
library(tidyverse)
library(ggplot2)
ee <- fread("dat.csv", select = c("br","tr","obs","ee"))
ee_r <- data.frame(a = 1:nrow(ee), Method = "OLD")
ee <- cbind(rename(ee, Acc = ee), ee_r)
dd <- fread("dat.csv", select = c("br","tr","obs","dd"))
dd_r <- data.frame(a = 1:nrow(dd), Method = "NEW")
dd <- cbind(rename(dd, Acc = dd), dd_r)
dat <- rbind(ee,dd)
dat <- subset(dat, select = -c(a))
dat$Acc[dat$Acc=="."] <- NA
br_nbs <- paste(dat$br, dat$obs, sep = "\n")
br_nbs
#data <- subset(dat, !is.na(Acc)) This command gives me error
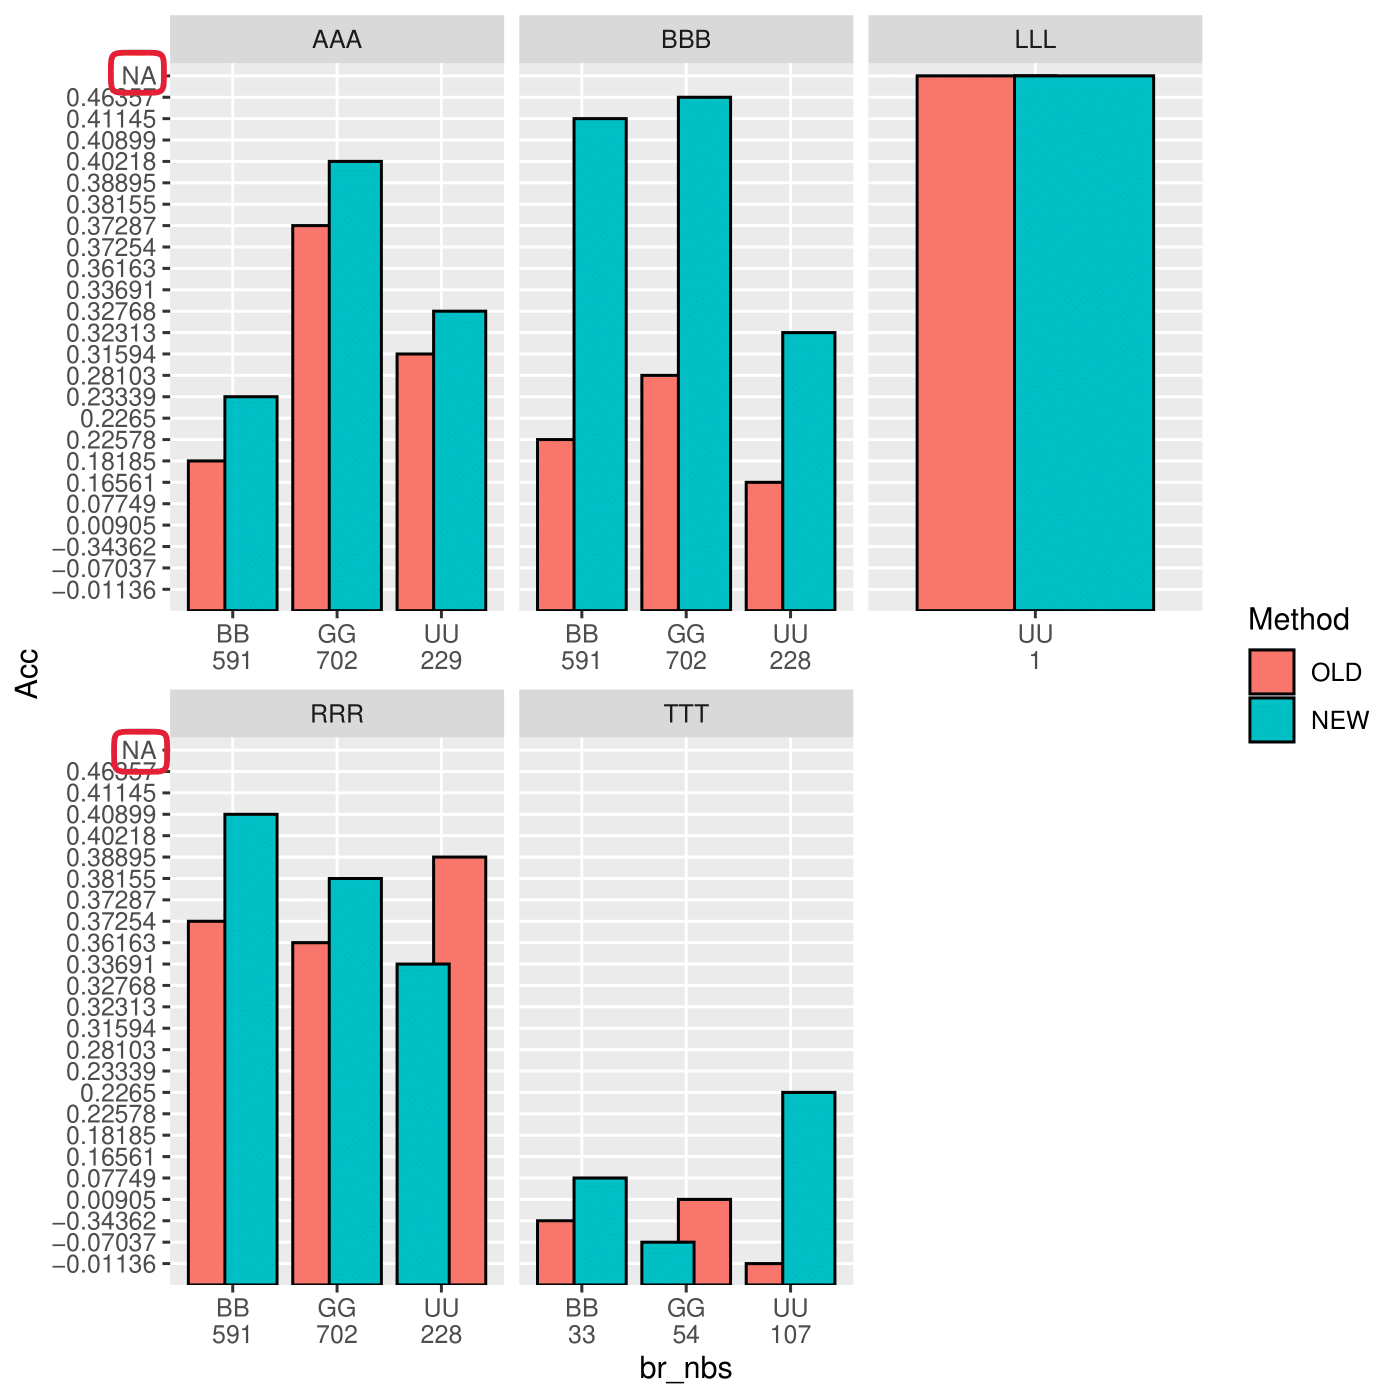
ggplot(dat, aes(x = br_nbs, y = Acc, fill = Method), na.rm=TRUE)+
geom_col(colour="black",width=1, position=position_dodge(0.7), na.rm=TRUE) +
facet_wrap(~tr, strip.position = "top", labeller = "label_value", scales = "free_x")下面是红色盒子里有NAs的情节:
我很感谢你的评论。
谢谢。
回答 1
Stack Overflow用户
发布于 2022-08-09 15:58:23
像@r2evans一样,我不确定您的输入数据实际上是什么。我想可能是这样:
dput(dat)
structure(list(br = c("UU", "BB", "GG", "UU", "BB", "GG", "UU",
"BB", "GG", "UU", "UU", "BB", "GG", "UU", "BB", "GG", "UU", "BB",
"GG", "UU", "BB", "GG", "UU", "UU", "BB", "GG"), tr = c("RRR",
"RRR", "RRR", "AAA", "AAA", "AAA", "BBB", "BBB", "BBB", "LLL",
"TTT", "TTT", "TTT", "RRR", "RRR", "RRR", "AAA", "AAA", "AAA",
"BBB", "BBB", "BBB", "LLL", "TTT", "TTT", "TTT"), obs = c(228L,
591L, 702L, 229L, 591L, 702L, 228L, 591L, 702L, 1L, 107L, 33L,
54L, 228L, 591L, 702L, 229L, 591L, 702L, 228L, 591L, 702L, 1L,
107L, 33L, 54L), Acc = c("0.38895", "0.37254", "0.36163", "0.31594",
"0.18185", "0.37287", "0.16561", "0.22578", "0.28103", ".", "-0.01136",
"-0.34362", "0.00905", "0.33691", "0.40899", "0.38155", "0.32768",
"0.23339", "0.40218", "0.32313", "0.41145", "0.46357", ".", "0.2265",
"0.07749", "-0.07037"), Method = c("OLD", "OLD", "OLD", "OLD",
"OLD", "OLD", "OLD", "OLD", "OLD", "OLD", "OLD", "OLD", "OLD",
"NEW", "NEW", "NEW", "NEW", "NEW", "NEW", "NEW", "NEW", "NEW",
"NEW", "NEW", "NEW", "NEW")), row.names = c(NA, 26L), class = "data.frame")现在,完成您的数据范围,关键是,添加br_nbs到数据框架。
dat$br_nbs <- paste(dat$br, dat$obs, sep = "\n")
dat$Acc[dat$Acc=="."] <- NA
并绘制数据,并对代码进行小修改。
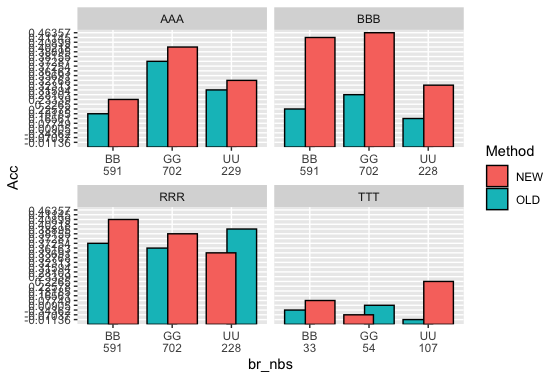
ggplot(dat %>% filter(!is.na(Acc)), aes(x = br_nbs, y = Acc, fill = Method))+
  geom_col(colour="black",width=1, position=position_dodge(0.7)) +
  facet_wrap(~tr, strip.position = "top", labeller = "label_value", scales = "free_x")
给予
页面原文内容由Stack Overflow提供。腾讯云小微IT领域专用引擎提供翻译支持
原文链接:
https://stackoverflow.com/questions/73294359
复制相关文章
相似问题
腾讯云开发者

Copyright © 2013 - 2026 Tencent Cloud. All Rights Reserved. 腾讯云 版权所有
深圳市腾讯计算机系统有限公司 ICP备案/许可证号:粤B2-20090059 ![]() 粤公网安备44030502008569号
粤公网安备44030502008569号
腾讯云计算(北京)有限责任公司 京ICP证150476号 | 京ICP备11018762号