
Prometheus HTTPS方案“无效”不是有效的启动令牌。
Prometheus HTTPS方案“无效”不是有效的启动令牌。
提问于 2022-08-09 11:01:18
试图使用Prometheus为几个公共端点构建端点监控解决方案,但我仍然遇到以下错误。
我正在使用Windows操作系统(不确定它是否有用)。
下面是我的prometheus.yml
# my global config
global:
scrape_interval: 15s # Set the scrape interval to every 15 seconds. Default is every 1 minute.
evaluation_interval: 15s # Evaluate rules every 15 seconds. The default is every 1 minute.
# scrape_timeout is set to the global default (10s).
# Alertmanager configuration
alerting:
alertmanagers:
- static_configs:
- targets:
# - alertmanager:9093
# Load rules once and periodically evaluate them according to the global 'evaluation_interval'.
rule_files:
# - "first_rules.yml"
# - "second_rules.yml"
# A scrape configuration containing exactly one endpoint to scrape:
# Here it's Prometheus itself.
scrape_configs:
# The job name is added as a label `job=<job_name>` to any timeseries scraped from this config.
- job_name: "Viewer"
metrics_path: '/v6/latest/USD'
scheme: https
tls_config:
insecure_skip_verify: true
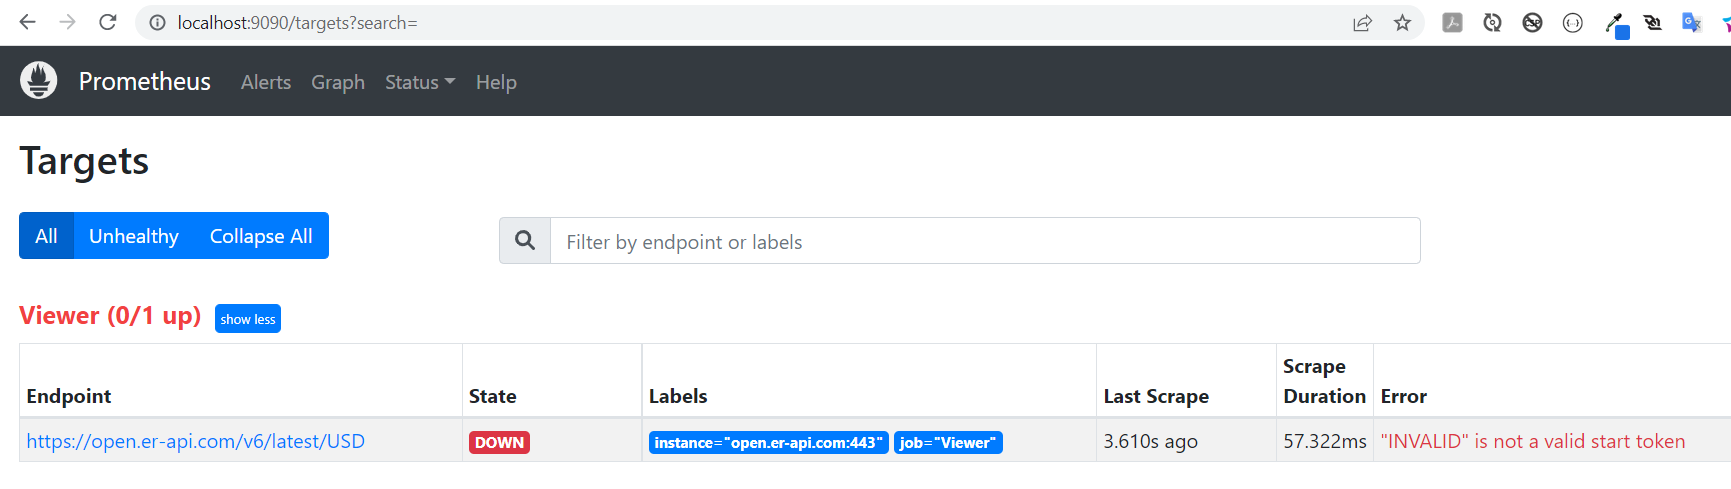
static_configs:
- targets: ["open.er-api.com:443"]在目标监控页面上,我发现了如下的错误-
回答 1
Stack Overflow用户
发布于 2022-08-09 11:31:41
您能在浏览器或卷曲中打开完整的度量路径吗?您是否使用任何开源出口商或您拥有?
普罗米修斯只能摄入这个格式化。你能确定这种格式是否正确吗?
页面原文内容由Stack Overflow提供。腾讯云小微IT领域专用引擎提供翻译支持
原文链接:
https://stackoverflow.com/questions/73290724
复制相关文章
相似问题
腾讯云开发者

Copyright © 2013 - 2026 Tencent Cloud. All Rights Reserved. 腾讯云 版权所有
深圳市腾讯计算机系统有限公司 ICP备案/许可证号:粤B2-20090059 ![]() 粤公网安备44030502008569号
粤公网安备44030502008569号
腾讯云计算(北京)有限责任公司 京ICP证150476号 | 京ICP备11018762号