
如何使用lapply按变量重新排序ggg图中的条形图
我想制作几个数字使用全球图形,并最终将他们保存到一个单一的pdf。下面我将StarWars数据集作为示例。我尝试了下面的代码,并能够为每个变量生成数字,但我想按每个数字的y值重新排序条形条。我在运行代码时还会收到警告消息,如下所示。
starwars <- as_tibble(starwars)

#Define the y variables I want to plot
variables <- c("height", "mass", "birth_year")

#Define my function to plot
plot_function <- function(var_names) {

  ggplot(starwars, aes_string(x ="name", y = var_names)) +
    geom_bar(stat = "identity") +
    theme_mine()
}


#Run function across variables of interest
p <- lapply(variables, plot_function)


#Save figures to pdf
ggsave(
  filename = "StarWarsTest.pdf",
  plot = marrangeGrob(p, nrow=5, ncol=3),
  width = 8.5, height = 11
)
我的警告信息:
> p <- lapply(variables, plot_function)
Warning messages:
1: In xtfrm.data.frame(x) : cannot xtfrm data frames
2: In xtfrm.data.frame(x) : cannot xtfrm data frames
3: In xtfrm.data.frame(x) : cannot xtfrm data frames

> ggsave(
+   filename = "StarWarsTest.pdf",
+   plot = marrangeGrob(p, nrow=5, ncol=3),
+   width = 8.5, height = 11
+ )
Warning messages:
1: Removed 6 rows containing missing values (position_stack).
2: Removed 28 rows containing missing values (position_stack).
3: Removed 44 rows containing missing values (position_stack). 除了上面的尝试之外,我还使用了ggplot的x = reorder(name, var_names)中的aes()命令条形图,而没有运气。
我希望每个图形看起来像它用这个代码产生的结果:
ggplot(starwars, aes(x = reorder(name, height), y = height)) +
  geom_bar(stat = "identity")
很抱歉有这么长的代码,任何帮助都将不胜感激。
回答 2
Stack Overflow用户
发布于 2022-08-04 16:40:33
我编辑以添加列名的标签。
我冒昧地对您的代码做了一些修改:
- 使用aes()代替aes_string()
- 从tibble转换到dataframe
- 变化函数
我所能提供的方法如下:
#Convert to dataframe
stars<-as.data.frame(starwars)
现在,在本例中,您需要数值变量和名称。因此,我只选择了相关的列。
#Select relevant columns
stars<-cbind(stars["name"],Filter(is.numeric,stars))

#Remove missing values
stars<- na.omit(stars)
让我们定义要绘制的函数:
#Define my function to plot
plot_function <- function(data_vars,colid) {
 ggplot(stars, aes(x=reorder(name,data_vars),y=data_vars)) +
 geom_bar(stat = "identity")+
 labs(y=colid)+
 coord_flip()
}
现在,这是重要的部分。要将函数运行到感兴趣的变量,我们不提供带有列名的字符向量。相反,我们用感兴趣的变量的dataframe列“输入”lapply()。因为我们想要列名,所以我们可以按每一列循环:
 #Run function across variables of interest

 stars_num<-Filter(is.numeric,stars)
 for (i in 1:3){
   p[[i]]<-lapply(stars_num[i], plot_function,
                 names(stars_num[i]))
  }
你应该得到你想要的输出。但肯定还有更好的选择。
Stack Overflow用户
发布于 2022-08-04 16:13:39
我冒昧地将您的代码转换为使用aes()而不是aes_string()。
要删除有关缺少值的警告,我们需要在绘图之前过滤starwars tibble以删除相应的行。因为lapply不使用NSE,所以我们需要在将列名传递给绘图函数之前引用它们。诚然,这很尴尬,我很想看到一种更清洁的替代方案。
尽管如此,请将您的plot_function重新定义为
plot_function <- function(y) {
  qY = enquo(y)
  starwars %>%
    filter(!is.na(!! qY)) %>%
    ggplot(aes(x=reorder(name, -(!! qY)), y=!! qY))+
      geom_bar(stat="identity") +
      labs(x="name")
}然后使用lapply
p <- lapply(c(quote(height), quote(mass), quote(birth_year)), plot_function)若要在没有警告或错误消息的情况下将重新排序的绘图保存到列表中,请执行以下操作。
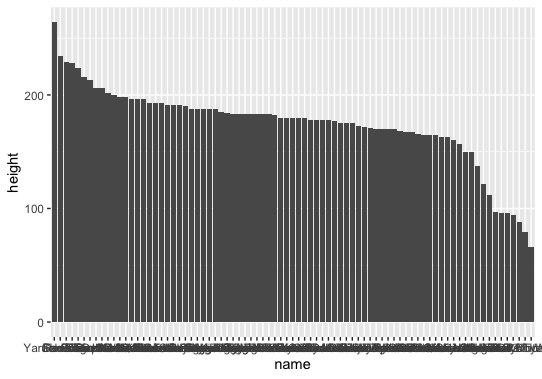
下面是列表中的一个元素:
在函数中使用enquo()和!!是处理函数内部tidyverse的NSE的一种方法。还有其他人。有关详细信息,请参阅这里。
https://stackoverflow.com/questions/73238761
复制相似问题
腾讯云开发者

Copyright © 2013 - 2026 Tencent Cloud. All Rights Reserved. 腾讯云 版权所有
深圳市腾讯计算机系统有限公司 ICP备案/许可证号:粤B2-20090059 ![]() 粤公网安备44030502008569号
粤公网安备44030502008569号
腾讯云计算(北京)有限责任公司 京ICP证150476号 | 京ICP备11018762号