
SwiftUI图表:向条形图栏添加标签
SwiftUI图表:向条形图栏添加标签
提问于 2022-07-29 16:18:59
我在SwiftUI中使用WWDC22 for iOS 16中引入的新图表框架。
我希望每个条形图的值都显示在条形图中,但我在图表框架中并没有看到这样的效果。我所能做的最好是使用一个ZStack,并在图表上尝试分层文本,这样可以工作,但当数据发生变化时,不会将文本保持在条形图的中心位置。
有人在SwiftUI图表中发现了一种本土化的方法吗?
回答 1
Stack Overflow用户
回答已采纳
发布于 2022-07-30 21:15:13
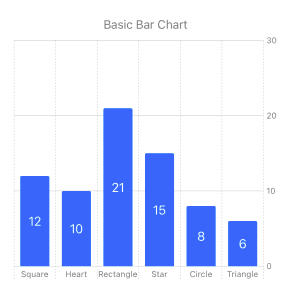
使用以下代码可以通过使用覆盖位置和中心对齐对齐来注释条形:
.annotation(position: .overlay, alignment: .center) {
  // your Text or other overlay here
}
带有注释的示例图表。
下面提供用于创建图表的完整代码,以供参考。
海图代码:
struct BarChart4: View {
    var body: some View {
        VStack(alignment: .center)  {
            Text("Basic Bar Chart")
                .font(.callout)
                .foregroundStyle(.secondary)

            Chart (BarData4.data) { shape in
                BarMark (
                    x: .value("Shape", shape.type),
                    y: .value("Count", shape.count)
                )
                .annotation(position: .overlay, alignment: .center) {
                    Text("\(shape.count, format: .number.precision(.fractionLength(0)))")
                        .foregroundColor(.white)
                }
            }
        }
    }
}
样本数据:
struct BarData4 {
    static let data: [ShapeModel] = [
        .init(type: "Square",    count: 12),
        .init(type: "Heart",     count: 10),
        .init(type: "Rectangle", count: 21),
        .init(type: "Star",      count: 15),
        .init(type: "Circle",    count: 8),
        .init(type: "Triangle",  count: 6)
    ]
}
和数据模型:
struct ShapeModel: Identifiable {
    var type: String
    var count: Double
    var id = UUID()
}页面原文内容由Stack Overflow提供。腾讯云小微IT领域专用引擎提供翻译支持
原文链接:
https://stackoverflow.com/questions/73168258
复制相关文章
相似问题
腾讯云开发者

Copyright © 2013 - 2026 Tencent Cloud. All Rights Reserved. 腾讯云 版权所有
深圳市腾讯计算机系统有限公司 ICP备案/许可证号:粤B2-20090059 ![]() 粤公网安备44030502008569号
粤公网安备44030502008569号
腾讯云计算(北京)有限责任公司 京ICP证150476号 | 京ICP备11018762号