
如何配置kafka图表将两者都公开:kafka-度量和kafka度量向prometheus公开?
我们使用卡夫卡图表(版本17)作为我们图表的依赖项。我试着配置对卡夫卡的监控。
values.yaml:
kafka:
  metrics:
    kafka:
      enabled: true
    jmx:
      enabled: true
    serviceMonitor:
      enabled: true
      labels:
        my.custom.label/service-monitor: "1.0"
   ...
然后部署我的应用程序并转到prometheus目标,我看到以下内容:
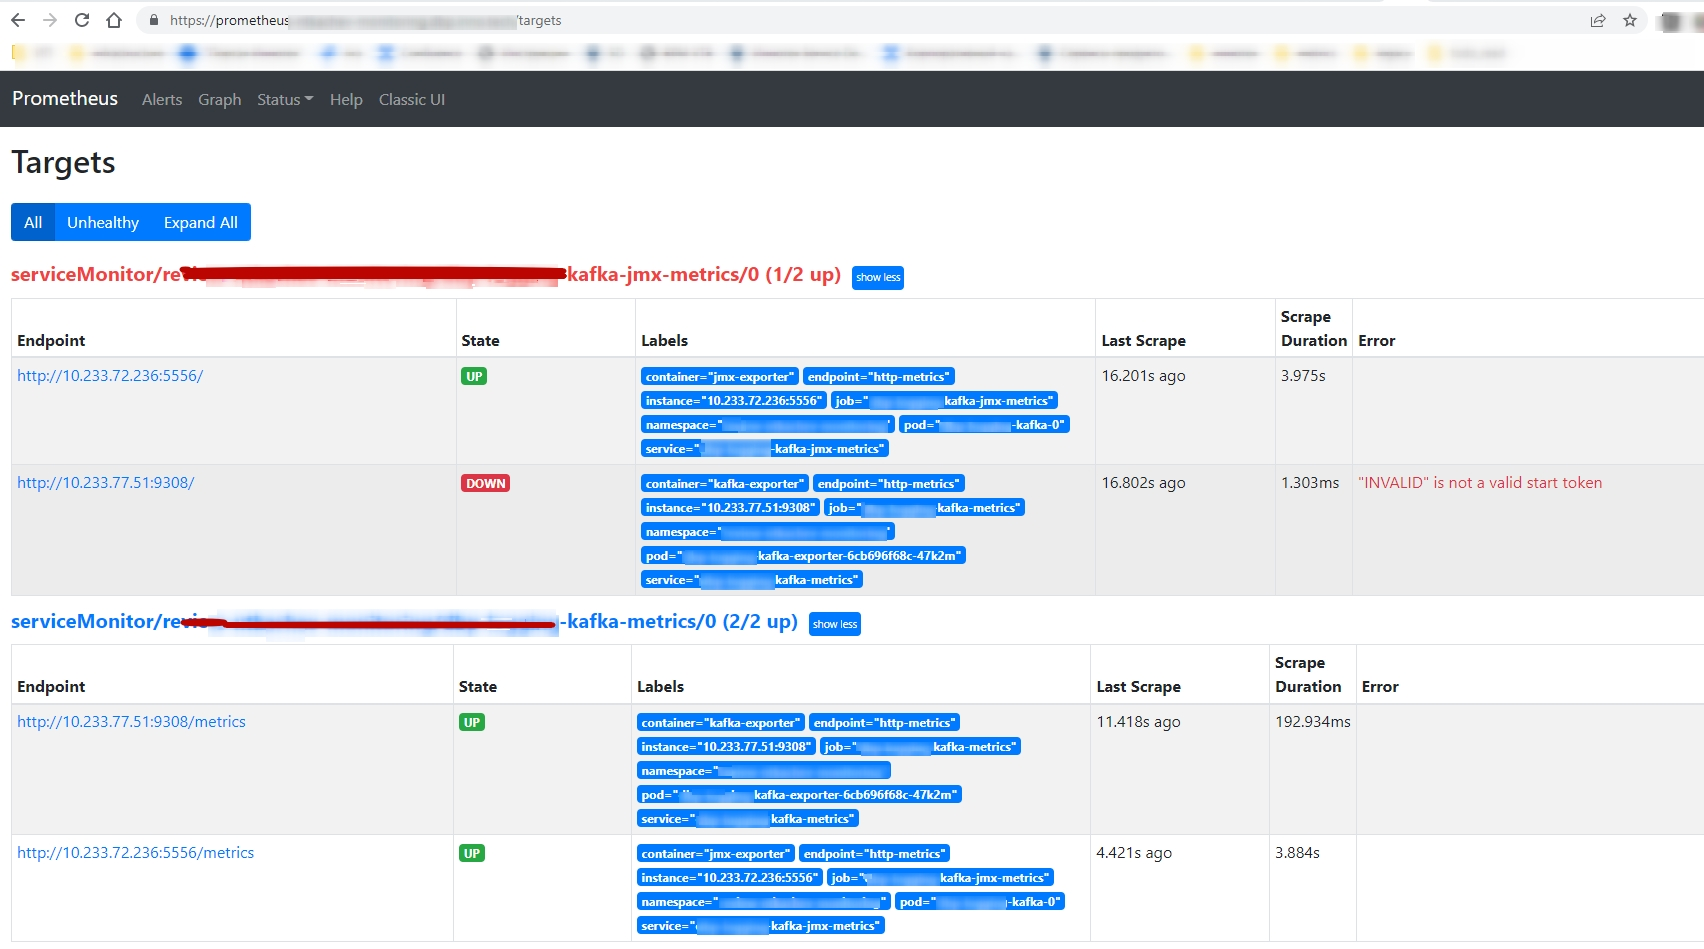
我对这一请求的失败感到关切。
我看到了什么?
有2项服务需要监测:
- jmx-exporter
- kafka-exporter
这两种服务都由两条路径请求:
- /
- /metrics
但kafka-exporter在/上没有回应。如果启用了2家出口商,是否有办法将kafka图表配置为无故障地工作?
附注:
服务定义:
spec:
  endpoints:
    - path: /
      port: http-metrics
  namespaceSelector:
    matchNames:
      - my-ns
  selector:
    matchLabels:
      app.kubernetes.io/component: metrics
      app.kubernetes.io/instance: dev-my-app
app.kubernetes.io/name: my-app-kafka-
spec:
  endpoints:
    - path: /metrics
      port: http-metrics
  namespaceSelector:
    matchNames:
      - my-ns
  selector:
    matchLabels:
      app.kubernetes.io/component: metrics
      app.kubernetes.io/instance: dev-my-app
app.kubernetes.io/name: my-app-kafka回答 2
Stack Overflow用户
发布于 2022-07-28 10:18:32
最后,我完成了以下解决方案:
我使用的是卡夫卡图表中的jmx出口商:
values.yaml
kafka:
  metrics:
    kafka:
      enabled: false
    jmx:
      enabled: true
    serviceMonitor:
      enabled:true
      labels:
       my.super.company/service-monitor: "1.0"

  enabled: true
并将kafka出口商登记为分离的受抚养人:
chart.yaml:
  - name: prometheus-kafka-exporter
    version: 1.6.0
    repository: https://prometheus-community.github.io/helm-charts
并手动配置:
values.yaml
prometheus-kafka-exporter:
  kafkaServer:
    - my-kafka-server:9092
  prometheus:
    serviceMonitor:
      enabled: true
      namespace: ""
      additionalLabels:
my.super.company/service-monitor: "1.0"Stack Overflow用户
发布于 2022-07-22 16:21:15
卡夫卡出口商没有对/做出回应。
这是因为web.telemetry-path默认为/metrics
https://github.com/danielqsj/kafka_exporter/blob/master/kafka_exporter.go#L700
你的ServiceMonitors混在一起了
以container=kafka-exporter结尾的
- 应该有
container=jmx-exporter标签 - ,以
kafka-metrics结尾的应该有container=jmx-exporter标签
目前,您已经在相反的ServiceMonitors中显示了每个容器中的一个。我怀疑这是因为您的标签选择器是完全相同的,但是对于不同的路径。
如果你只有一个卡夫卡经纪人,你应该只有2个目标。一个JMX出口商(每个经纪人)和一个Kafka出口商。
因此,两个经纪商将有3个目标:2个JMX出口商和1个Kafka出口商(因为它适用于整个集群)。
https://stackoverflow.com/questions/73083028
复制相似问题
腾讯云开发者

Copyright © 2013 - 2026 Tencent Cloud. All Rights Reserved. 腾讯云 版权所有
深圳市腾讯计算机系统有限公司 ICP备案/许可证号:粤B2-20090059 ![]() 粤公网安备44030502008569号
粤公网安备44030502008569号
腾讯云计算(北京)有限责任公司 京ICP证150476号 | 京ICP备11018762号