
ggplot: geom_text over geom_bar
ggplot: geom_text over geom_bar
提问于 2022-07-19 19:16:52
我有以下数据:
foo = read.table(text="
protein1    1.51E-02    5   label1
protein2    9.06E-05    850 label2
protein3    3.38E-05    1155    label1
protein4    3.38E-05    1154    label1
protein5    6.64E-03    35  label3
protein6    5.32E-03    44  label4",
sep="\t", col.names=c("category", "value", "rank", "ToLabel"))我想绘制一个rank (x轴)和value (y轴)的条形图,并添加一个存储在ToLabel列中的标签。
这是我的密谋代码:
ggplot(data=foo, aes(x=rank, y=value)) +
  geom_bar(stat="identity") +
  geom_col(fill="dark grey") +
  labs(x = "Rank",
       y = "Value") +
  theme_bw() +
  theme(panel.grid.major = element_blank(), panel.grid.minor = element_blank()) +
  scale_x_continuous(expand = c(0, 0)) + scale_y_continuous(expand = c(0, 0)) +
  scale_fill_manual( values = c( "yes"="red", "no"="black" ), guide = "none" ) +
  geom_pointrange(data = foo, aes(x=rank, y=value, ymin = 0, ymax = 0)) +
  #geom_text(data = genes_df, aes(x=rank, y=relative_iBAQ, label = ToText), vjust = 0, angle=45, size = 1)
  geom_text(data = foo, aes(label = ToLabel),
            position = position_stack(vjust = 1.1), angle=45, size = 3)
不幸的是,标签不在我的绘图区域内:
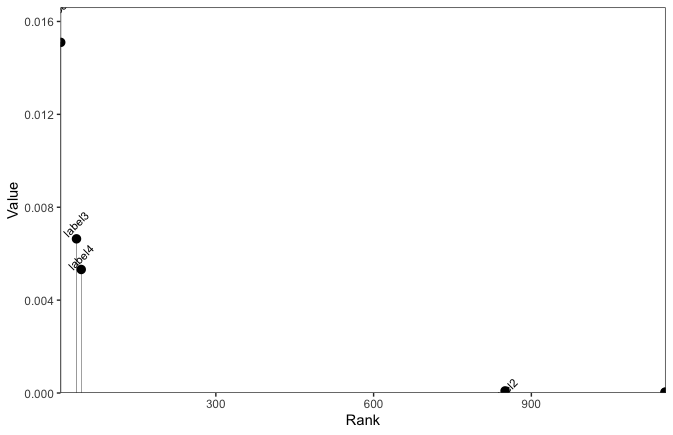
到目前为止,我还没有找到移动它们的方法。知道如何更好地定位标签吗?
回答 2
Stack Overflow用户
回答已采纳
发布于 2022-07-21 14:34:34
您可以使用nudge_x和nudge_y参数来调整文本,但必须停止使用position才能工作。有关详细信息,请参阅?geom_text帮助页面。
我还建议不要在x轴上使用expand(0, 0),这样标签就会有一些填充。
您可以使用hjust控制文本的合理性。默认的hjust = 0.5将文本以其坐标为中心。向左设置hjust = 0将使文本在其坐标上正确。
Stack Overflow用户
发布于 2022-07-20 00:42:55
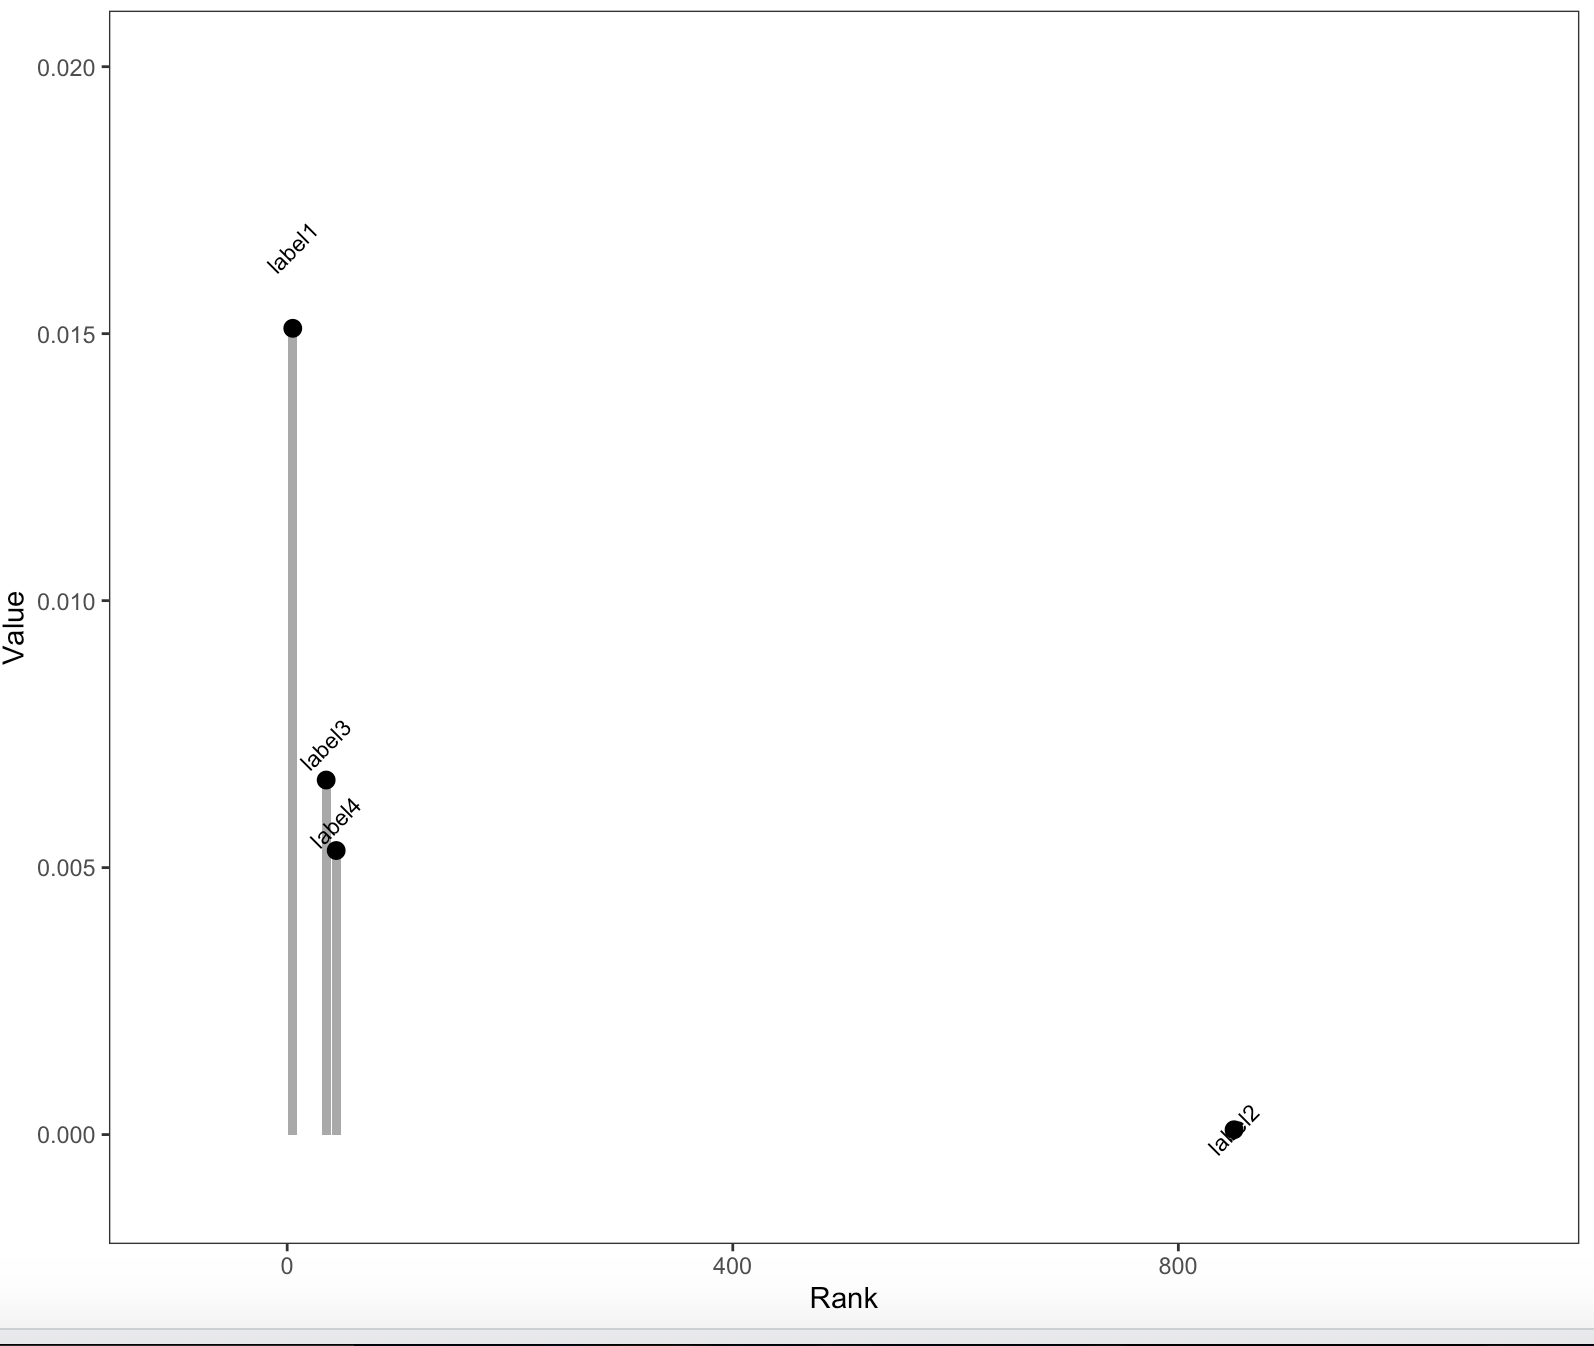
我添加了xlim和ylim值。但Thomas指出,如果删除展开(0,0),则不需要这样做。
xlim(-100, 1100) +
ylim(-.001, .02)
页面原文内容由Stack Overflow提供。腾讯云小微IT领域专用引擎提供翻译支持
原文链接:
https://stackoverflow.com/questions/73042394
复制相关文章
相似问题
腾讯云开发者

Copyright © 2013 - 2026 Tencent Cloud. All Rights Reserved. 腾讯云 版权所有
深圳市腾讯计算机系统有限公司 ICP备案/许可证号:粤B2-20090059 ![]() 粤公网安备44030502008569号
粤公网安备44030502008569号
腾讯云计算(北京)有限责任公司 京ICP证150476号 | 京ICP备11018762号