
常微分方程的曲线拟合
常微分方程的曲线拟合
提问于 2022-07-19 18:46:48
我想把曲线拟合成下面所示的颂歌-
dA/dt = k1*profit + k2
我有观察到的变量A和profit的时间序列,我想利用python中的曲线拟合技术得到k1和k2的最优值。我可以编写下面的代码,但解决方案不适合,或者我的方法是错误的。
import numpy as np
from scipy.optimize import curve_fit
from scipy.integrate import odeint

def fitfunc(t, k1, k2):
    'Function that returns A computed from an ODE for k1 and k2'
    def myode(area, t):
        profit = get_profit(t)
        return k1*profit + k2

    A0 = 200000    #initial value of A
    out = odeint(myode, A0, t)
    return out[:,0]

k_fit, kcov = curve_fit(fitfunc, time_span, obs_A)  #time span from 1999-2019 and obs_A is the observed values of A

modeled_A = fitfunc(time_span, k_fit[0], k_fit[1])
20年期间的利润和obs_A数据如下:
profit = [ 7.65976374e+06, -6.13172279e+06,  1.03946093e+07,  2.59937877e+06,
       -7.88358386e+06, -1.38918115e+04, -3.13403157e+06, -4.74348806e+06,
        1.87296164e+07,  4.13680709e+07, -1.77191198e+07,  2.39249499e+06,
        1.38521564e+07,  6.52548348e+07, -5.78102494e+07, -5.72469988e+07,
       -5.99056006e+06, -1.72424523e+07,  1.78509987e+07,  9.27860105e+06,
       -9.96709853e+06]

obs_A = [200000., 165000., 150000., 180000., 190000., 195000., 200000.,
       165000., 280000., 235000., 250000., 250000., 250000., 295000.,
       295000., 285000., 245000., 315000., 235000., 245000., 305000.]

time_span = np.arange(1999,2020)这里,get_profit是一个函数,它输出给定t的利润值,它是通过插值观察到的profit数据创建的,如下所示-
profit_fun = interp1d(t, profit.values, 1, fill_value="extrapolate")

def get_profit(t):
return profit_fin(t)我不知道如何在这里使用profit变量,因为它在每个时间步骤中都会发生变化。我的方法正确吗?
回答 1
Stack Overflow用户
发布于 2022-07-20 16:21:23
(根据要求,这是代码)
首先,把事情安排好。只添加了fitfun2,它修改了fitfunc,删除了对get_profit的调用(因此不插值数据)。
import numpy as np
from scipy.optimize import curve_fit
from scipy.integrate import odeint
from scipy.interpolate import interp1d
import matplotlib.pyplot as plt

def fitfunc(t, k1, k2):  # Original
    'Function that returns A computed from an ODE for k1 and k2'
    def myode(area, t):
        profit = get_profit(t)
        return k1*profit + k2

    A0 = 20000    #initial value of A
    out = odeint(myode, A0, t)
    return out[:,0]

def fitfunc2(t, k1, k2): # Modified
    'Modified fitfunc, removing the call to `profit_fun`'
    def myode(area, t):
        return k1*t+k2

    A0 = 20000    #initial value of A
    out = odeint(myode, A0, t)
    return out[:,0]

profit = np.array([ 7.65976374e+06, -6.13172279e+06,  1.03946093e+07,  2.59937877e+06,
       -7.88358386e+06, -1.38918115e+04, -3.13403157e+06, -4.74348806e+06,
        1.87296164e+07,  4.13680709e+07, -1.77191198e+07,  2.39249499e+06,
        1.38521564e+07,  6.52548348e+07, -5.78102494e+07, -5.72469988e+07,
       -5.99056006e+06, -1.72424523e+07,  1.78509987e+07,  9.27860105e+06,
       -9.96709853e+06])

obs_A = np.array([200000., 165000., 150000., 180000., 190000., 195000., 200000.,
       165000., 280000., 235000., 250000., 250000., 250000., 295000.,
       295000., 285000., 245000., 315000., 235000., 245000., 305000.])

time_span = np.arange(1999,2020)

profit_fun = interp1d(time_span, profit, 1, fill_value="extrapolate")

def get_profit(t):
    return profit_fun(t)
现在,对结果进行拟合和绘图
p0 = (1E-2, 1E4)
k_fit, kcov = curve_fit(fitfunc, time_span, obs_A, p0=p0)
k_fit2, kcov2 = curve_fit(fitfunc2, time_span, obs_A, p0=p0)

modeled_A = fitfunc(time_span, *k_fit)
guess_A = fitfunc(time_span, *p0)

modeled_A2 = fitfunc2(time_span, *k_fit2)
guess_A2 = fitfunc2(time_span, *p0)

plt.plot(time_span, obs_A, marker='o', lw=0, label='data')
plt.plot(time_span, modeled_A, label='model A (original)')
plt.plot(time_span, modeled_A2, label='model A (modified)')
plt.plot(time_span, guess_A, label='initial guess (original)')
plt.plot(time_span, guess_A2, label='initial guess (modified)')

plt.legend()
这是一个图表:
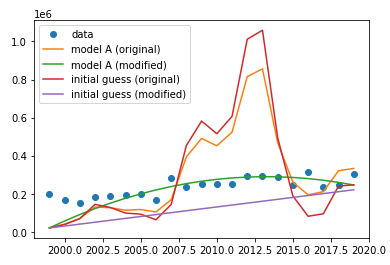
正如我所提到的,修改参数k不影响原始模型的曲线形状。看起来还是有点“循序渐进”。删除对get_profit的调用,曲线变得更加平滑,但我不知道这是否是@it 729所期望的。
页面原文内容由Stack Overflow提供。腾讯云小微IT领域专用引擎提供翻译支持
原文链接:
https://stackoverflow.com/questions/73042095
复制相关文章
相似问题
腾讯云开发者

Copyright © 2013 - 2026 Tencent Cloud. All Rights Reserved. 腾讯云 版权所有
深圳市腾讯计算机系统有限公司 ICP备案/许可证号:粤B2-20090059 ![]() 粤公网安备44030502008569号
粤公网安备44030502008569号
腾讯云计算(北京)有限责任公司 京ICP证150476号 | 京ICP备11018762号