
医学数据集微调后的ViT注意图可视化
我已经导入了Vit-b32模型,并对其进行了微调,以执行回波图像的分类任务。现在,我想要可视化的注意地图,以便我可以知道,在图像的哪一部分,模型的重点是做分类任务。但我无法做到这一点,当我试图在微调模型后的注意力图可视化时,我得到了一个错误。以下是代码:
!pip install --quiet vit-keras
from vit_keras import vit
vit_model = vit.vit_b32(
        image_size = IMAGE_SIZE,
        activation = 'softmax',
        pretrained = True,
        include_top = False,
        pretrained_top = False,
        classes = 3)
当我尝试将注意力图可视化,而不进行任何修改时,它是没有任何错误的:
from vit_keras import visualize
x = test_gen.next()
image = x[0]
attention_map = visualize.attention_map(model = vit_model, image = image)
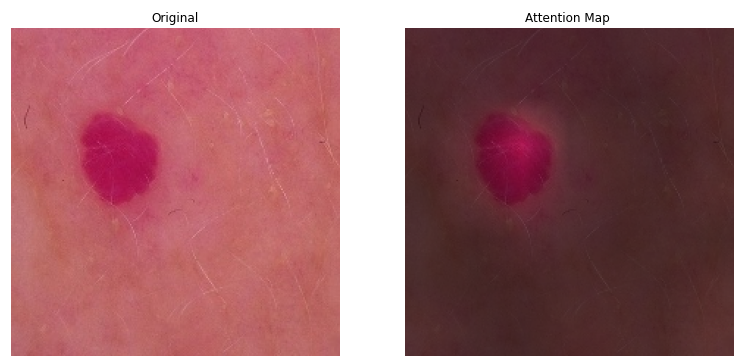
# Plot results
fig, (ax1, ax2) = plt.subplots(ncols = 2)
ax1.axis('off')
ax2.axis('off')
ax1.set_title('Original')
ax2.set_title('Attention Map')
_ = ax1.imshow(image)
_ = ax2.imshow(attention_map)现在,在下面的代码中,我向模型添加了一些分类层,并对其进行了微调:
model = tf.keras.Sequential([
        vit_model,
        tf.keras.layers.Flatten(),
        tf.keras.layers.BatchNormalization(),
        tf.keras.layers.Dense(11, activation = tfa.activations.gelu),
        tf.keras.layers.BatchNormalization(),
        tf.keras.layers.Dense(3, 'softmax')
    ],
    name = 'vision_transformer')

model.summary()
下面是上述单元格的输出:
> Model: "vision_transformer"
> _________________________________________________________________ Layer (type)                 Output Shape              Param #
> ================================================================= vit-b32 (Functional)         (None, 768)               87455232
> _________________________________________________________________ flatten_1 (Flatten)          (None, 768)               0
> _________________________________________________________________ batch_normalization_2 (Batch (None, 768)               3072
> _________________________________________________________________ dense_2 (Dense)              (None, 11)                8459
> _________________________________________________________________ batch_normalization_3 (Batch (None, 11)                44
> _________________________________________________________________ dense_3 (Dense)              (None, 3)                 36
> ================================================================= Total params: 87,466,843 Trainable params: 87,465,285 Non-trainable
> params: 1,558
> _________________________________________________________________
现在我已经在我自己的医学数据集上训练了这个模型:
learning_rate = 1e-4

optimizer = tfa.optimizers.RectifiedAdam(learning_rate = learning_rate)

model.compile(optimizer = optimizer,
              loss = tf.keras.losses.CategoricalCrossentropy(label_smoothing = 0.2),
              metrics = ['accuracy'])

STEP_SIZE_TRAIN = train_gen.n // train_gen.batch_size
STEP_SIZE_VALID = valid_gen.n // valid_gen.batch_size

reduce_lr = tf.keras.callbacks.ReduceLROnPlateau(monitor = 'val_accuracy',
                                                 factor = 0.2,
                                                 patience = 2,
                                                 verbose = 1,
                                                 min_delta = 1e-4,
                                                 min_lr = 1e-6,
                                                 mode = 'max')

earlystopping = tf.keras.callbacks.EarlyStopping(monitor = 'val_accuracy',
                                                 min_delta = 1e-4,
                                                 patience = 5,
                                                 mode = 'max',
                                                 restore_best_weights = True,
                                                 verbose = 1)

checkpointer = tf.keras.callbacks.ModelCheckpoint(filepath = './model.hdf5',
                                                  monitor = 'val_accuracy',
                                                  verbose = 1,
                                                  save_best_only = True,
                                                  save_weights_only = True,
                                                  mode = 'max')

callbacks = [earlystopping, reduce_lr, checkpointer]

model.fit(x = train_gen,
          steps_per_epoch = STEP_SIZE_TRAIN,
          validation_data = valid_gen,
          validation_steps = STEP_SIZE_VALID,
          epochs = EPOCHS,
          callbacks = callbacks)

model.save('model.h5', save_weights_only = True)
在训练后,当我试图将模型的注意力图可视化时,它显示了错误:
from vit_keras import visualize

x = test_gen.next()
image = x[0]

attention_map = visualize.attention_map(model = model, image = image)

# Plot results
fig, (ax1, ax2) = plt.subplots(ncols = 2)
ax1.axis('off')
ax2.axis('off')
ax1.set_title('Original')
ax2.set_title('Attention Map')
_ = ax1.imshow(image)
_ = ax2.imshow(attention_map)
以下是以下错误:
---------------------------------------------------------------------------
TypeError                                 Traceback (most recent call last)
<ipython-input-13-f208f2d2b771> in <module>
      4 image = x[0]
      5
----> 6 attention_map = visualize.attention_map(model = model, image = image)
      7
      8 # Plot results

/opt/conda/lib/python3.7/site-packages/vit_keras/visualize.py in attention_map(model, image)
     14     """
     15     size = model.input_shape[1]
---> 16     grid_size = int(np.sqrt(model.layers[5].output_shape[0][-2] - 1))
     17
     18     # Prepare the input

TypeError: 'NoneType' object is not subscriptable
请提出一些纠正上述错误的方法,并将微调模型的注意图可视化。
回答 2
Stack Overflow用户
发布于 2022-08-16 06:03:12
您可以通过以下操作来可视化注意力地图。
attention_map = visualize.attention_map(model=model.layers[0], image=image)由于attention_map假设一个ViT模型作为模型参数,所以需要指定被定义为tf.keras.Sequential的优化模型的第一个元素。
Stack Overflow用户
发布于 2022-09-03 23:34:06
我有个解决办法。
我有一个字符串中的图像路径,用OpenCv库打开它,并预先加载了一个ViT模型。
我认为您只需要使用方法get_layer,并选择您的Vit,因为您完全在顺序模型中使用它,它作为一个层工作。
path='/content/drive/MyDrive/TFM/Harvard_procesado/ISIC_0025612.jpg'
img = cv2.imread(path)
img = cv2.cvtColor(img, cv2.COLOR_BGR2RGB)
res = cv2.resize(img, dsize=(224,224), interpolation=cv2.INTER_CUBIC)

attention_map1 = visualize.attention_map(model = vit_model_t.get_layer('vit_model'), image = res)

fig = plt.figure(figsize=(20,20))
ax = plt.subplot(1, 2, 1)
ax.axis('off')
ax.set_title('Original')
_ = ax.imshow(res)

ax = plt.subplot(1, 2, 2)
ax.axis('off')
ax.set_title('Attention Map')
_ = ax.imshow(attention_map1)
https://stackoverflow.com/questions/73026144
复制相似问题
腾讯云开发者

Copyright © 2013 - 2026 Tencent Cloud. All Rights Reserved. 腾讯云 版权所有
深圳市腾讯计算机系统有限公司 ICP备案/许可证号:粤B2-20090059 ![]() 粤公网安备44030502008569号
粤公网安备44030502008569号
腾讯云计算(北京)有限责任公司 京ICP证150476号 | 京ICP备11018762号