
Matplotlib叠加条形图集列顺序
Matplotlib叠加条形图集列顺序
提问于 2022-07-15 10:24:58
我正在用通常的方法绘制几个固定数量的堆叠条形图:
bar = df.plot.barh(x='Intervention', y={'Remuneration','Training','Supervision'}, stacked=True )但是,我注意到,根据输入数据集,matplotlib改变了绘制列的顺序。例如,有时将薪酬作为堆叠条形图的第一个组成部分,而在其他情况下则将薪酬改为培训或监督。老实说,我还没有弄清楚正在使用的订单是什么。理想情况下,我希望始终保持相同的顺序,因为我有一个颜色列表,以供使用。有什么办法强迫我们重新排序吗?堆叠的条形图总是以薪酬培训监督的形式出现吗?
回答 1
Stack Overflow用户
回答已采纳
发布于 2022-07-15 14:03:12
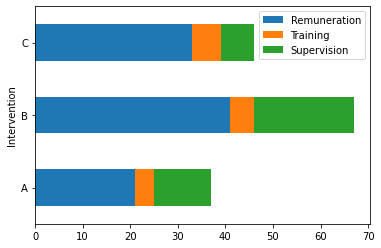
要为堆叠条形图设置自定义顺序,您需要通过设置CategoricalIndex并按这些类别对数据进行排序。这将按您需要的方式对这三个类别进行排序。下面是一个很小的例子.
数据'df'
Intervention    Remuneration    Training    Supervision
A   21  4   12
B   41  5   21
C   33  6   7
码
#Convert Intervention as index, so columns are the categories
df = df.set_index('Intervention')

#Set categories... Order will Remuneration-Training-Supervision
df.columns=pd.CategoricalIndex(df.columns.values, ordered=True, categories=['Remuneration','Training','Supervision'])

#Sort the data
df = df.sort_index(axis=1)

#...and plot
bar = df.plot.barh(stacked=True)
输出
页面原文内容由Stack Overflow提供。腾讯云小微IT领域专用引擎提供翻译支持
原文链接:
https://stackoverflow.com/questions/72992554
复制相关文章
相似问题
腾讯云开发者

Copyright © 2013 - 2026 Tencent Cloud. All Rights Reserved. 腾讯云 版权所有
深圳市腾讯计算机系统有限公司 ICP备案/许可证号:粤B2-20090059 ![]() 粤公网安备44030502008569号
粤公网安备44030502008569号
腾讯云计算(北京)有限责任公司 京ICP证150476号 | 京ICP备11018762号