
基于密度图的热图绘制方法
基于密度图的热图绘制方法
提问于 2022-07-14 09:55:08
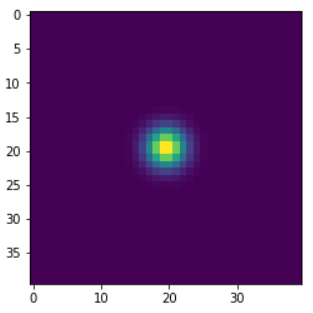
我试图从一个给定的分布中绘制一个热图。例如,2D数组的正态分布如下所示:

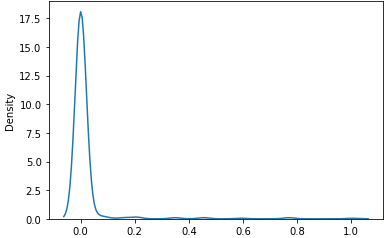
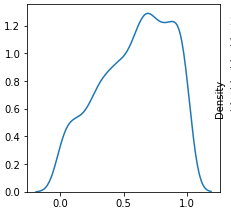
如果我有另一个像这样的密度图:
我怎么能画出一张像第一张的热图。这是我用来绘制第一张热图的代码:
  output_width = 40
  output_height = 40
  p_x = 20
  p_y = 20
  sigma = 1
  X1 = np.linspace(0, output_width, output_width)
  Y1 = np.linspace(0, output_height, output_height)
  [X, Y] = np.meshgrid(X1, Y1)
  X = X - floor(p_x)
  Y = Y - floor(p_y)
  D2 = X * X + Y * Y
  E2 = 2.0 * sigma ** 2
  Exponent = D2 / E2
  heatmap = np.exp(-Exponent)
  heatmap = (heatmap - heatmap.min()) / (heatmap.max() - heatmap.min())
plt.imshow(heatmap)回答 1
Stack Overflow用户
发布于 2022-07-14 10:54:49
output_width = 40
output_height = 40
mu = 0; sigma=0.1
x, y = np.meshgrid(np.linspace(-1, 1, 40),
                   np.linspace(-1, 1, 40))
dst = np.sqrt(x**2+y**2)

# lower normal part of gaussian
normal = 1/(2.0 * np.pi * sigma**2)

# Calculating Gaussian filter
gauss = np.exp(-((dst-mu)**2 / (2.0 * sigma**2))) * normal
plt.imshow(gauss)
给予:
页面原文内容由Stack Overflow提供。腾讯云小微IT领域专用引擎提供翻译支持
原文链接:
https://stackoverflow.com/questions/72978626
复制相关文章
相似问题
腾讯云开发者

Copyright © 2013 - 2026 Tencent Cloud. All Rights Reserved. 腾讯云 版权所有
深圳市腾讯计算机系统有限公司 ICP备案/许可证号:粤B2-20090059 ![]() 粤公网安备44030502008569号
粤公网安备44030502008569号
腾讯云计算(北京)有限责任公司 京ICP证150476号 | 京ICP备11018762号