
用项目共存频率建立稀疏矩阵(分析产品交叉销售)
用项目共存频率建立稀疏矩阵(分析产品交叉销售)
提问于 2022-07-13 10:05:26
我坚持创建一个稀疏矩阵,在这个矩阵中,我可以根据购物车和产品ids计算产品交叉销售的频率。
样本数据框架:
x = data.frame(
      cart_id = c("1","1","1","2","2","3","4","5","5","6"),
      product_id = c("A","B","C","D","A","F","G","A","C","F")
)
最理想的输出:一个稀疏矩阵,其中包含两个产品在同一个购物车中出现的次数。
有什么暗示吗?
编辑:
这两个答案都解决了这个问题。
回答 2
Stack Overflow用户
回答已采纳
发布于 2022-07-13 14:49:12
这是一个非常有趣的问题/应用程序!
您的两列i x展示了什么产品在什么购物车中,但您感兴趣的是products 和 j 落入同一购物车中的事件。您并不关心它是什么特定的购物车;相反,您想要计算这样的事件发生了多少次。
当然,您的预期输出是一个应急表(一个带有计数的平方矩阵)。然而,计数必须首先计算,这不是一个简单的任务。下面的注释很好的函数可以做到这一点。
Contingency <- function (product_id, cart_id) {
  ## unique product ID
  ProductID <- unique(product_id)
  ## let's use a consecutive numeric ID for product
  ProductIDnum <- match(product_id, ProductID)
  ## split products by cart
  CartItems <- unname(split(ProductIDnum, cart_id))
  ## number of products in each cart
  nItemsPerCart <- lengths(CartItems)
  ## we are only interested in carts with 2+ different products
  CartItems <- CartItems[nItemsPerCart >= 2]
  CartItems <- lapply(CartItems, sort)
  ## an event: a pair of products (i, j) fall into one same cart
  ## (note that we don't care which particular cart it is)
  ## here, `Events` is a 2-column matrix where each row is an event
  ## this matrix will have duplicated rows so that we can `aggregate`
  Events <- t(do.call("cbind", lapply(CartItems, combn, m = 2)))
  ## aggregate: how many times does each event happen?
  Freq <- aggregate(rep(1, nrow(Events)), data.frame(Events), sum)
  ## (i, j, x) triplet for a "TsparseMatrix"
  i <- Freq[[1]]
  j <- Freq[[2]]
  x <- Freq[[3]]
  ## the dimension of the square matrix
  n <- length(ProductID)
  Matrix::sparseMatrix(i = i, j = j, x = x, symmetric = TRUE, dims = c(n, n),
                       dimnames = list(ProductID, ProductID))
}
现在,我们可以将其应用于您的dataset x。
mat <- Contingency(x$product_id, x$cart_id)
#6 x 6 sparse Matrix of class "dsCMatrix"
# A B C D F G
#A . 1 2 1 . .
#B 1 . 1 . . .
#C 2 1 . . . .
#D 1 . . . . .
#F . . . . . .
#G . . . . . .
## dense form (not recommended if there are lots of products)
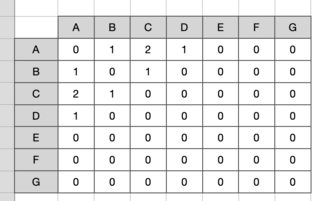
as.matrix(mat)
# A B C D F G
#A 0 1 2 1 0 0
#B 1 0 1 0 0 0
#C 2 1 0 0 0 0
#D 1 0 0 0 0 0
#F 0 0 0 0 0 0
#G 0 0 0 0 0 0您还可以使用xtabs和crossprod
mat <- Matrix::crossprod(xtabs(~ ., data = x, sparse = TRUE))
#6 x 6 sparse Matrix of class "dsCMatrix"
#  A B C D F G
#A 3 1 2 1 . .
#B 1 1 1 . . .
#C 2 1 2 . . .
#D 1 . . 1 . .
#F . . . . 2 .
#G . . . . . 1
剩下的唯一方法是将对角线条目设置为零:
diag(mat) <- 0
mat
#  A B C D F G
#A 0 1 2 1 . .
#B 1 0 1 . . .
#C 2 1 0 . . .
#D 1 . . 0 . .
#F . . . . 0 .
#G . . . . . 0但是请注意,"diag<-"在这里做的不是很好,因为在存储意义上,替换0没有被视为零。
该死!我刚找到了一个陷阱:Creating co-occurrence matrix。
Stack Overflow用户
发布于 2022-07-13 20:11:11
使用as.dist +“交叉产品+表”的基本R选项可以实现
> as.matrix(as.dist(crossprod(table(x))))
  A B C D F G
A 0 1 2 1 0 0
B 1 0 1 0 0 0
C 2 1 0 0 0 0
D 1 0 0 0 0 0
F 0 0 0 0 0 0
G 0 0 0 0 0 0页面原文内容由Stack Overflow提供。腾讯云小微IT领域专用引擎提供翻译支持
原文链接:
https://stackoverflow.com/questions/72964447
复制相关文章
相似问题
腾讯云开发者

Copyright © 2013 - 2026 Tencent Cloud. All Rights Reserved. 腾讯云 版权所有
深圳市腾讯计算机系统有限公司 ICP备案/许可证号:粤B2-20090059 ![]() 粤公网安备44030502008569号
粤公网安备44030502008569号
腾讯云计算(北京)有限责任公司 京ICP证150476号 | 京ICP备11018762号