
R数据汇总和图表
R数据汇总和图表
提问于 2022-07-11 21:02:47
ID <- c(1,2,3,4,5)
DrugA <- c(1,1,0,0,0)
DrugB <- c(0,0,1,0,1)
TreatmentLevel <- c("Inpatient","Outpatient","Outpatient","Inpatient","Outpatient")
df <- data.frame(ID,DrugA,DrugB,TreatmentLevel)
df %>%
pivot_longer(starts_with("Drug"), names_to = "Var") %>%
group_by(TreatmentLevel, Var) %>%
summarise(value = sum(!is.na(value))) %>%
pivot_wider(names_from = TreatmentLevel, values_from = value)
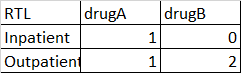
# A tibble: 2 x 3
Var Inpatient Outpatient
<chr> <int> <int>
1 DrugA 2 3
2 DrugB 2 3我想把这些数据汇总到下表中。但我的桌子弄错了。你还能帮我用ggplot2画一张图吗?
回答 1
Stack Overflow用户
回答已采纳
发布于 2022-07-11 21:30:58
问题是您还计算了0值。要获得您想要的结果,您可以这样做:
library(dplyr)
library(tidyr)
library(ggplot2)
tbl <- df %>%
pivot_longer(starts_with("Drug"), names_to = "Var") %>%
count(TreatmentLevel, Var, wt = value)
tbl
#> # A tibble: 4 × 3
#> TreatmentLevel Var n
#> <chr> <chr> <dbl>
#> 1 Inpatient DrugA 1
#> 2 Inpatient DrugB 0
#> 3 Outpatient DrugA 1
#> 4 Outpatient DrugB 2
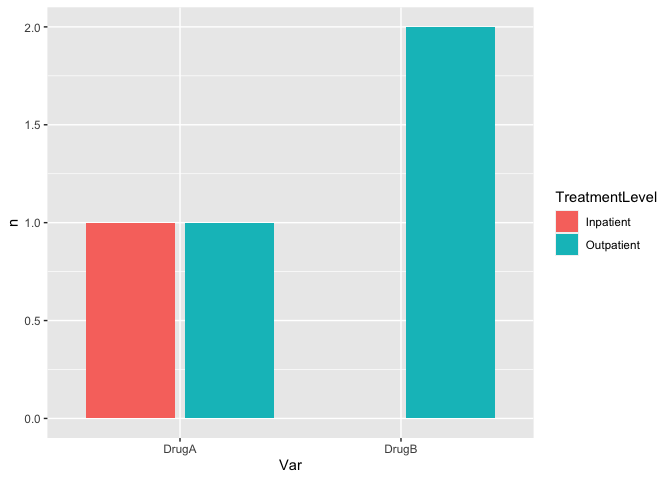
ggplot(tbl, aes(Var, n, fill = TreatmentLevel)) +
geom_col(position = "dodge2")
页面原文内容由Stack Overflow提供。腾讯云小微IT领域专用引擎提供翻译支持
原文链接:
https://stackoverflow.com/questions/72944656
复制相关文章
相似问题
腾讯云开发者

Copyright © 2013 - 2026 Tencent Cloud. All Rights Reserved. 腾讯云 版权所有
深圳市腾讯计算机系统有限公司 ICP备案/许可证号:粤B2-20090059 ![]() 粤公网安备44030502008569号
粤公网安备44030502008569号
腾讯云计算(北京)有限责任公司 京ICP证150476号 | 京ICP备11018762号