
“餐厅”参数未访问Pylance
“餐厅”参数未访问Pylance
提问于 2022-07-08 23:29:41
为什么它给了我一个错误,说参数“餐馆不能访问Pylance?”
我的完整代码如下
import numpy as np
import random as rand
import matplotlib.pyplot as plt

#Unknown restaurant standard deviations
actual_restaurant1 = np.random.normal(loc = rand.randint(1,50), scale = rand.randint(1,10))
actual_restaurant2 = np.random.normal(loc = rand.randint(1,50), scale = rand.randint(1,10))

stand_dev1 = 100
stand_dev2 = 100
mean1 = 0
mean2 = 0
number_of_visits1 = 0
number_of_visits2 = 0

restaurant1 = np.random.normal(loc = mean1, scale = stand_dev1)
restaurant2 = np.random.normal(loc = mean2, scale = stand_dev2)

def update(restaurant, actual_restaurant, number_of_visits, stand_dev, mean):
    number_of_visits = number_of_visits + 1
    stand_dev = (1 / 10000 + number_of_visits) ** (-1)
    mean = actual_restaurant
    restaurant = np.random.normal(loc = mean, scale = stand_dev, size = 100000)

if restaurant1 > restaurant2:
    update(restaurant1, actual_restaurant1, number_of_visits1, stand_dev1, mean1)
elif restaurant2 > restaurant1:
    update(restaurant2, actual_restaurant2, number_of_visits2, stand_dev2, mean2)

plt.hist(restaurant1, 100)
plt.show()回答 1
Stack Overflow用户
发布于 2022-07-09 01:51:10
当您的函数被调用时,该函数似乎接收的是作为第一个参数的值列表,而不是对“餐馆”变量的引用,这似乎与python语言描述函数的方式相反。可能是因为餐厅统计样本的变量或对象的类型,这就是函数接受数据的方式。我无法解释。因为这似乎是正在发生的事情,所以我得到更新您的"restaurant1“或"restaurant2”对象的程序的方式是将函数调用设置为接收餐馆列表的等式。然后,程序生成适当的直方图。以下是您程序的修订版。
import numpy as np
import random as rand
import matplotlib.pyplot as plt
#Unknown restaurant standard deviations
actual_restaurant1 = np.random.normal(loc = rand.randint(1,50), scale = rand.randint(1,10))
actual_restaurant2 = np.random.normal(loc = rand.randint(1,50), scale = rand.randint(1,10))
stand_dev1 = 100
stand_dev2 = 100
mean1 = 0
mean2 = 0
number_of_visits1 = 0
number_of_visits2 = 0
restaurant1 = np.random.normal(loc = mean1, scale = stand_dev1)
restaurant2 = np.random.normal(loc = mean2, scale = stand_dev2)
def update(restaurant, actual_restaurant, number_of_visits, stand_dev, mean):
number_of_visits = number_of_visits + 1
stand_dev = (1 / 10000 + number_of_visits) ** (-1)
mean = actual_restaurant
restaurant = np.random.normal(loc = mean, scale = stand_dev, size = 100000)
return restaurant # This returns the value to be used in updating your restaurant variable.
if restaurant1 >= restaurant2:
restaurant1 = update(restaurant1, actual_restaurant1, number_of_visits1, stand_dev1, mean1)
plt.hist(restaurant1, 100)
plt.title('Restaurant #1')
elif restaurant2 > restaurant1:
restaurant2 = update(restaurant2, actual_restaurant2, number_of_visits2, stand_dev2, mean2)
plt.hist(restaurant2, 100)
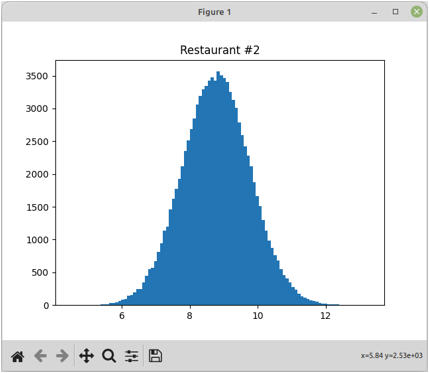
plt.title('Restaurant #2')
plt.show()当我运行代码时,我确实得到了一个具有相当对称的钟形曲线的直方图。
正如我所说的,函数定义似乎将餐馆变量当作一组常量数据来处理,就好像要用常量调用函数一样。
average_value(24, 88, x)有点伤脑筋。不管怎样,试一试,看看它是否对你有帮助。
致以问候。
页面原文内容由Stack Overflow提供。腾讯云小微IT领域专用引擎提供翻译支持
原文链接:
https://stackoverflow.com/questions/72917881
复制相关文章
相似问题
腾讯云开发者

Copyright © 2013 - 2026 Tencent Cloud. All Rights Reserved. 腾讯云 版权所有
深圳市腾讯计算机系统有限公司 ICP备案/许可证号:粤B2-20090059 ![]() 粤公网安备44030502008569号
粤公网安备44030502008569号
腾讯云计算(北京)有限责任公司 京ICP证150476号 | 京ICP备11018762号