
注释网格的每个方面
注释网格的每个方面
提问于 2022-07-07 21:20:50
我正在寻找一个文本框添加到一个facet_grid的每个方面。我有一个类似于此的数据框架:
test<- structure(list(group = c(1, 2, 3, 4, 5, 1, 2, 3, 4, 5, 1, 2,
3, 4, 5, 1, 2, 3, 4, 5, 1, 2, 3, 4, 5, 1, 2, 3, 4, 5), species = c("A",
"A", "A", "A", "A", "B", "B", "B", "B", "B", "C", "C", "C", "C",
"C", "A", "A", "A", "A", "A", "B", "B", "B", "B", "B", "C", "C",
"C", "C", "C"), value = c(10, 7, 4, 3, 1, 9, 3, 2, 2, 1, 6, 4,
3, 1, 1, 4, 3, 3, 2, 1, 10, 9, 6, 3, 1, 7, 7, 4, 2, 1), season = c("spring",
"spring", "spring", "spring", "spring", "spring", "spring", "spring",
"spring", "spring", "spring", "spring", "spring", "spring", "spring",
"fall", "fall", "fall", "fall", "fall", "fall", "fall", "fall",
"fall", "fall", "fall", "fall", "fall", "fall", "fall")), row.names = c(NA,
-30L), class = "data.frame")
图中有以下内容:
ggplot(test, aes(x=group, y=value))+
  geom_point(size=2, show.legend=F)+
  geom_line()+
  facet_grid(season ~ species, scales= "fixed")+
  xlab("")+
  ylab("")+
  scale_x_continuous(limits = c(1,5), breaks=seq(1,5,1))+
  theme_light()+
  theme(strip.text = element_text(face = "bold", color = "black",
                                  hjust = .5, size = 10),
        strip.background = element_rect(color = "black"),
        panel.border = element_rect(color="black"),
        panel.grid.minor.x= element_blank(),
        panel.grid.minor.y = element_blank())
我有一个数据框架,其中包含每个面板的标签:
labels<- structure(list(label = c("n=1", "n=2", "n=3", "n=4", "n=5", "n=6"
), species = c("A", "B", "C", "A", "B", "C"), season = c("spring",
"spring", "spring", "fall", "fall", "fall"), x = c(4, 4, 4, 4,
4, 4), y = c(8, 8, 8, 8, 8, 8)), row.names = c(NA, -6L), class = "data.frame")
# the X and Y columns are the coordinates of where I want the label to appear in each facet
当我只使用一个facet_wrap时,我能够获得所需的输出,但是当我使用网格时,我无法获得与正确的行和列相对应的标签。
任何帮助/洞察力都将不胜感激。
回答 1
Stack Overflow用户
回答已采纳
发布于 2022-07-07 21:26:59
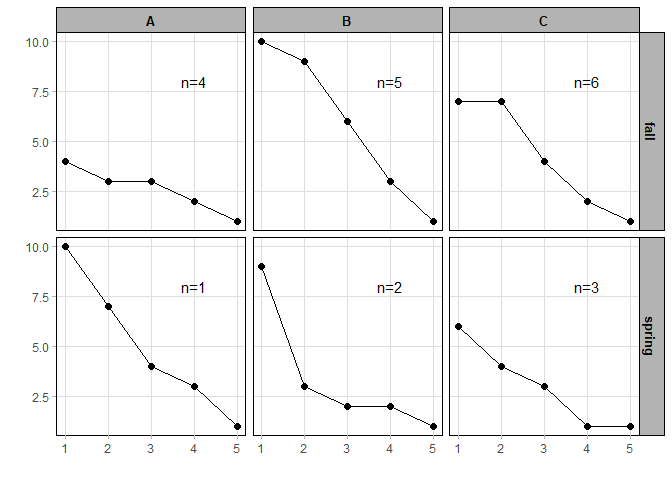
我可能没有意识到这方面的困难,但在我看来,geom_text()只是简单地做了充分的工作。
ggplot(test, aes(x=group, y=value))+
  geom_point(size=2, show.legend=F)+
  geom_line()+
  geom_text(aes(x = x, y = y, label = label),
            data = labels) +
  facet_grid(season ~ species, scales= "fixed")+
  xlab("")+
  ylab("")+
  scale_x_continuous(limits = c(1,5), breaks=seq(1,5,1))+
  theme_light()+
  theme(strip.text = element_text(face = "bold", color = "black",
                                  hjust = .5, size = 10),
        strip.background = element_rect(color = "black"),
        panel.border = element_rect(color="black"),
        panel.grid.minor.x= element_blank(),
        panel.grid.minor.y = element_blank())
页面原文内容由Stack Overflow提供。腾讯云小微IT领域专用引擎提供翻译支持
原文链接:
https://stackoverflow.com/questions/72904362
复制相关文章
相似问题
腾讯云开发者

Copyright © 2013 - 2026 Tencent Cloud. All Rights Reserved. 腾讯云 版权所有
深圳市腾讯计算机系统有限公司 ICP备案/许可证号:粤B2-20090059 ![]() 粤公网安备44030502008569号
粤公网安备44030502008569号
腾讯云计算(北京)有限责任公司 京ICP证150476号 | 京ICP备11018762号