
利用Makie.jl实现朱莉娅中等高线色条的对数标度
利用Makie.jl实现朱莉娅中等高线色条的对数标度
提问于 2022-06-29 14:32:03
如何处理contourf图在Julia中的对数刻度?(使用Makie.jl)我只想用10到10000的值来绘制一个二维数据文件,并使用对数色条,但是我找不到怎么做。我已经看到在heatmap中有一个关于这个主题的公开问题,但是我找不到关于contourf的任何东西。
假设我有字段v
julia> v
7×7 Array{Int64,2}:
    2   600    50     2   600    50     2
   50  7000  5000    50  7000  5000    50
  300    20    60   300    20    60   300
 5000     3    70  5000     3    70  5000
   70   150  1000    70   150  1000    70
 1000  8000     2  1000  8000     2  1000
3000 500 1 3000 500 1 3000如果我尝试用Makie和contourf绘制这个字段
julia> fig, ax, im = contourf(1:7, 1:7, v, levels=0:50:10000)
julia> Colorbar(fig[1,2], im)
julia> save("./plot.png", fim)
我明白了:
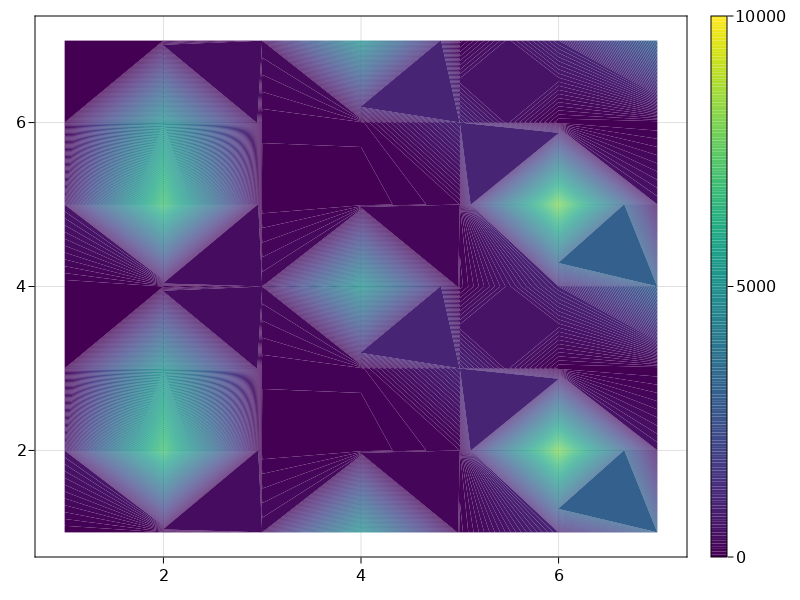
我的问题是如何在colormap和colorbar刻度中使用对数标度来可视化小值之间的差异.
回答 1
Stack Overflow用户
回答已采纳
发布于 2022-06-29 15:52:12
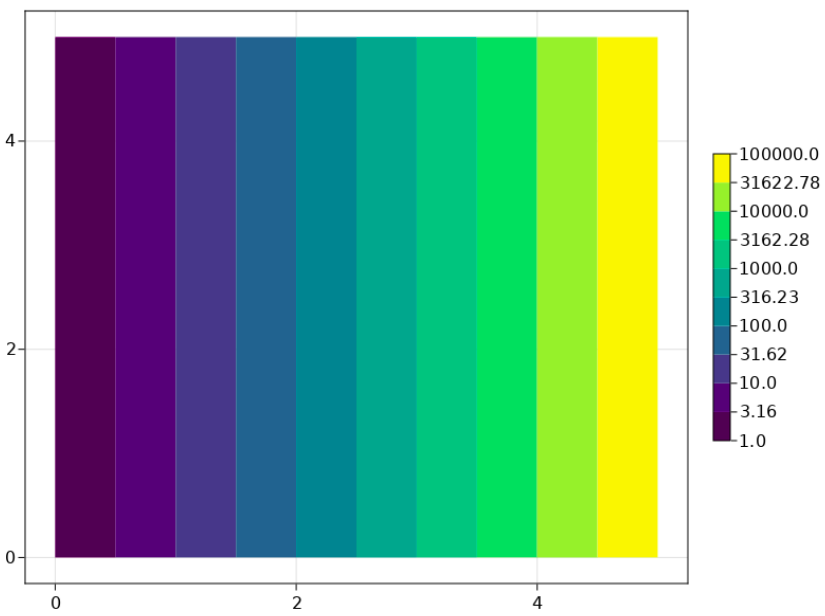
我想出的最佳解决方案是将您的值转换为日志空间。下面是:
using CairoMakie

# Generate a tool field
X1, X2 = 0:.1:5, 0:.1:5
X3 = [ 10 ^ x1 for x1 in X1, x2 in X2 ]
lvls = 10 .^ collect( X1 )

# Note: we apply log10 to field and levels!
fig = Figure()
ax = Axis( fig[1, 1] )
ctf = contourf!( ax, X1, X2, log10.( X3 ), levels = log10.( lvls[1:5:end] ) )

# We make the ticks string (non-log) match the ticks values (log)
ticks_val = log10.( lvls[1:5:end] )
ticks_str = string.( round.(lvls[1:5:end]; digits = 2) )    # Here we can even write by hand a nicer string that has exponents
Colorbar(fig[1,2], ctf, height = Relative(1/2), ticks = (ticks_val, ticks_str) )
fig
它应该给你这样的答案:
页面原文内容由Stack Overflow提供。腾讯云小微IT领域专用引擎提供翻译支持
原文链接:
https://stackoverflow.com/questions/72803173
复制相关文章
相似问题
腾讯云开发者

Copyright © 2013 - 2026 Tencent Cloud. All Rights Reserved. 腾讯云 版权所有
深圳市腾讯计算机系统有限公司 ICP备案/许可证号:粤B2-20090059 ![]() 粤公网安备44030502008569号
粤公网安备44030502008569号
腾讯云计算(北京)有限责任公司 京ICP证150476号 | 京ICP备11018762号