
如何在侏儒图中关闭y轴?
如何在侏儒图中关闭y轴?
提问于 2022-06-28 12:44:34
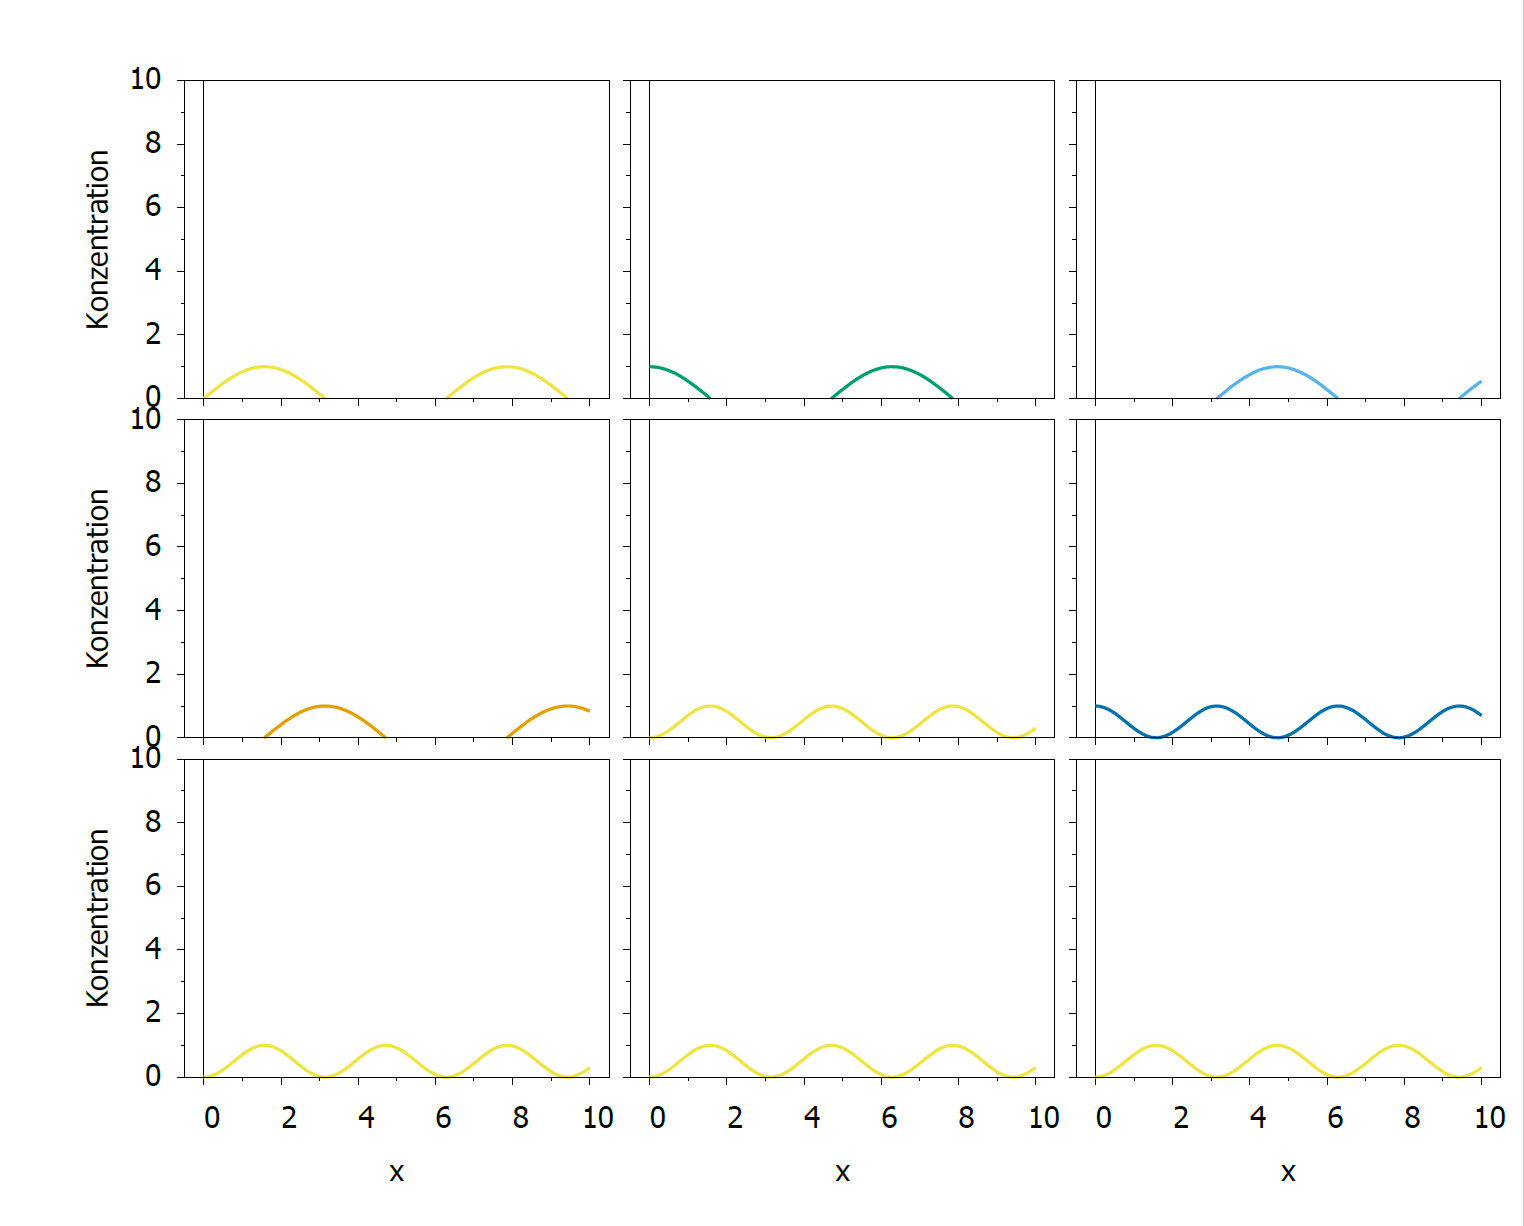
我的目标是关闭我的阴谋的y轴。抽搐被放置在边界上,我希望在情节开始之前有一个小的缺口。"unset yzeroaxis“不知何故什么也做不了。
另一个问题是,我如何将x轴的数字对齐?现在,他们似乎是左对齐。
代码和输出如下。不要介意这些轴,函数只是示例,并且为以后将读取的数据做好了缩放准备。
#-----------------------------------------------
# Spacing
#-----------------------------------------------

mpl_top    = 0.4 #inch  outer top margin, title goes here
mpl_bot    = 0.7 #inch  outer bottom margin, x label goes here
mpl_left   = 0.9 #inch  outer left margin, y label goes here
mpl_right  = 0.1 #inch  outer right margin, y2 label goes here
mpl_height = 1.5 #inch  height of individual plots
mpl_width  = 2.0 #inch  width of individual plots
mpl_dx     = 0.1 #inch  inter-plot horizontal spacing
mpl_dy     = 0.1 #inch  inter-plot vertical spacing
mpl_ny     = 3   #number of rows
mpl_nx     = 3   #number of columns

# calculate full dimensions
xsize = mpl_left+mpl_right+(mpl_width*mpl_nx)+(mpl_nx-1)*mpl_dx
ysize = mpl_top+mpl_bot+(mpl_ny*mpl_height)+(mpl_ny-1)*mpl_dy

# placement functions
#   rows are numbered from bottom to top
bot(n) = (mpl_bot+(n-1)*mpl_height+(n-1)*mpl_dy)/ysize
top(n)  = 1-((mpl_top+(mpl_ny-n)*(mpl_height+mpl_dy))/ysize)
#   columns are numbered from left to right
left(n) = (mpl_left+(n-1)*mpl_width+(n-1)*mpl_dx)/xsize
right(n)  = 1-((mpl_right+(mpl_nx-n)*(mpl_width+mpl_dx))/xsize)


#-----------------------------------------------
# Settings
#-----------------------------------------------

set terminal pdf enhanced color dl 2.0 size xsize,ysize font "Helvetica,12"
set encoding iso_8859_1
set tics scale 0.5

set output 'multiplot.pdf'

set offsets 0.5,0.5
set autoscale fix
set size 1,1
set key
set border
unset yzeroaxis

# define x-axis settings for all subplots
set xrange [0:10]
set xlabel ''
set format x ''
set xtics border out nomirror 2
set mxtics 2

# define y-axis settings for all subplots


#define linestyles
set style line 1 lc rgb "red" lw 2
set style line 2 lc rgb "blue" lw 2

# for csv
set datafile separator ','

# start plotting
set multiplot

#-----------------------------------------------
# subplot  1-3 (oben links)
#-----------------------------------------------

#  set horizontal margins for first column
set lmargin at screen left(1)
set rmargin at screen right(1)
#  set horizontal margins for third row (top)
set tmargin at screen top(3)
set bmargin at screen bot(3)

#set title 'left'

set ylabel 'Konzentration'
set yrange [0:10]
set format y '%g'
set ytics border out nomirror 2
set mytics 2

#set arrow 1 from graph 0, first 0 rto graph 1,0 nohead lt 1 lw 1 lc 0
#set arrow 2 from first 0, graph 0 rto 0, graph 1 nohead lt 1 lw 1 lc 0

plot plot          \
(sin(x)) \
axes x1y1 \
title '' \
with lines lt 1 lc 5 lw 2\
;

#-----------------------------------------------
# subplot  2-3 (oben mitte)
#-----------------------------------------------

#  set horizontal margins for second column
set lmargin at screen left(2)
set rmargin at screen right(2)
#  set horizontal margins for third row (top)
set tmargin at screen top(3)
set bmargin at screen bot(3)

#set title 'right'

set ylabel ''             # no label here
set yrange [0:10]
set format y ''           # no tic labels
set ytics auto
#set mytics 2
unset yzeroaxis

set arrow 1 from graph 0, first 0 rto graph 1,0 nohead lt 1 lw 1 lc 0
set arrow 2 from first 0, graph 0 rto 0, graph 1 nohead lt 1 lw 1 lc 0

plot          \
cos(x) \
axes x1y1 \
title '' \
with lines lt 1 lc 2 lw 2\
;

#-----------------------------------------------
# subplot  3-3 (oben rechts)
#-----------------------------------------------

#  set horizontal margins for first column
set lmargin at screen left(3)
set rmargin at screen right(3)
#  set horizontal margins for second row (middle)
set tmargin at screen top(3)
set bmargin at screen bot(3)

set title ''

set ylabel ''             # no label here
set yrange [0:10]
set format y ''           # no tic labels
set ytics auto
#set mytics 2

set arrow 1 from graph 0, first 0 rto graph 1,0 nohead lt 1 lw 1 lc 0
set arrow 2 from first 0, graph 0 rto 0, graph 1 nohead lt 1 lw 1 lc 0

plot          \
-sin(x) \
axes x1y1 \
title '' \
with lines lt 1 lc 3 lw 2\
;

#-----------------------------------------------
# subplot  1-2 (mitte links)
#-----------------------------------------------

#  set horizontal margins for second column
set lmargin at screen left(1)
set rmargin at screen right(1)
#  set horizontal margins for second row (middle)
set tmargin at screen top(2)
set bmargin at screen bot(2)

set title ''

set ylabel 'Konzentration'
set yrange [0:10]
set format y '%g'
set ytics auto
#set mytics 2

set arrow 1 from graph 0, first 0 rto graph 1,0 nohead lt 1 lw 1 lc 0
set arrow 2 from first 0, graph 0 rto 0, graph 1 nohead lt 1 lw 1 lc 0

plot          \
-cos(x) \
axes x1y1 \
title '' \
with lines lt 1 lc 4 lw 2\
;

#-----------------------------------------------
# subplot  2-2 (mitte mitte)
#-----------------------------------------------

#  set horizontal margins for first column
set lmargin at screen left(2)
set rmargin at screen right(2)
#  set horizontal margins for first row (bottom)
set tmargin at screen top(2)
set bmargin at screen bot(2)

set title ''

set ylabel ''             # no label here
set yrange [0:10]
set format y ''           # no tic labels
set ytics auto
#set mytics 2

set arrow 1 from graph 0, first 0 rto graph 1,0 nohead lt 1 lw 1 lc 0
set arrow 2 from first 0, graph 0 rto 0, graph 1 nohead lt 1 lw 1 lc 0

plot          \
(sin(x))**2 \
axes x1y1 \
title '' \
with lines lt 1 lc 5 lw 2\
;

#-----------------------------------------------
# subplot  3-2 (mitte rechts)
#-----------------------------------------------

#  set horizontal margins for second column
set lmargin at screen left(3)
set rmargin at screen right(3)
#  set horizontal margins for first row (bottom)
set tmargin at screen top(2)
set bmargin at screen bot(2)

set title ''

set ylabel ''             # no label here
set yrange [0:10]
set format y ''           # no tic labels
set ytics auto
#set mytics 2

set arrow 1 from graph 0, first 0 rto graph 1,0 nohead lt 1 lw 1 lc 0
set arrow 2 from first 0, graph 0 rto 0, graph 1 nohead lt 1 lw 1 lc 0

plot          \
(cos(x))**2 \
axes x1y1 \
title '' \
with lines lt 1 lc 6 lw 2\
;

#-----------------------------------------------
# subplot  1-1 (unten links)
#-----------------------------------------------

#  set horizontal margins for first column
set lmargin at screen left(1)
set rmargin at screen right(1)
#  set horizontal margins for first row (bottom)
set tmargin at screen top(1)
set bmargin at screen bot(1)

set title ''

# now set a label and tic marks for the x-axis
set xlabel "x"
set format y '%g'
set xtics add ('0' 0, '2' 2, '4' 4, '6' 6, '8' 8, '10' 10)

set ylabel "Konzentration"
set yrange [0:10]
set format y '%g'
set ytics auto
#set mytics 2

set arrow 1 from graph 0, first 0 rto graph 1,0 nohead lt 1 lw 1 lc 0
set arrow 2 from first 0, graph 0 rto 0, graph 1 nohead lt 1 lw 1 lc 0

plot          \
(sin(x))**2 \
axes x1y1 \
title '' \
with lines lt 1 lc 5 lw 2\
;

#-----------------------------------------------
# subplot  2-1 (unten mitte)
#-----------------------------------------------

#  set horizontal margins for first column
set lmargin at screen left(2)
set rmargin at screen right(2)
#  set horizontal margins for first row (bottom)
set tmargin at screen top(1)
set bmargin at screen bot(1)

set title ''

# now set a label and tic marks for the x-axis
set xlabel "x"
set format y '%g'
set xtics add ('0' 0, '2' 2, '4' 4, '6' 6, '8' 8, '10' 10)

set ylabel ''             # no label here
set yrange [0:10]
set format y ''           # no tic labels
set ytics auto
#set mytics 2

set arrow 1 from graph 0, first 0 rto graph 1,0 nohead lt 1 lw 1 lc 0
set arrow 2 from first 0, graph 0 rto 0, graph 1 nohead lt 1 lw 1 lc 0

plot          \
(sin(x))**2 \
axes x1y1 \
title '' \
with lines lt 1 lc 5 lw 2\
;

#-----------------------------------------------
# subplot  3-1 (unten rechts)
#-----------------------------------------------

#  set horizontal margins for first column
set lmargin at screen left(3)
set rmargin at screen right(3)
#  set horizontal margins for first row (bottom)
set tmargin at screen top(1)
set bmargin at screen bot(1)

set title ''

# now set a label and tic marks for the x-axis
set xlabel 'x'
set format y '%g'
set xtics add ('0' 0, '2' 2, '4' 4, '6' 6, '8' 8, '10' 10)

set ylabel ''             # no label here
set yrange [0:10]
set format y ''           # no tic labels
set ytics auto
#set mytics 2

set arrow 1 from graph 0, first 0 rto graph 1,0 nohead lt 1 lw 1 lc 0
set arrow 2 from first 0, graph 0 rto 0, graph 1 nohead lt 1 lw 1 lc 0

plot          \
(sin(x))**2 \
axes x1y1 \
title '' \
with lines lt 1 lc 5 lw 2\
;
unset multiplot
unset output
回答 1
Stack Overflow用户
回答已采纳
发布于 2022-06-28 13:16:35
您正在显式设置多次:
set arrow 1 from graph 0, first 0 rto graph 1,0 nohead lt 1 lw 1 lc 0
set arrow 2 from first 0, graph 0 rto 0, graph 1 nohead lt 1 lw 1 lc 0
它基本上就是一个y零轴和一个xzeroaxis。只要去掉这些线就行了。
即使您为第一个子图注释掉了这些行,如果您再次从控制台启动代码,除非您用一行reset session启动脚本,否则箭头、标签和对象也将是持久的。
xtics center行应该这样做。否则,您可以选择offset。检查help xtics。
顺便说一句,一旦你设置了一个范围或另一个设置,它将被保留为下一个(子)图。您需要多次指定相同的内容。你的代码可以大大缩短。
页面原文内容由Stack Overflow提供。腾讯云小微IT领域专用引擎提供翻译支持
原文链接:
https://stackoverflow.com/questions/72786680
复制相关文章
相似问题
腾讯云开发者

Copyright © 2013 - 2026 Tencent Cloud. All Rights Reserved. 腾讯云 版权所有
深圳市腾讯计算机系统有限公司 ICP备案/许可证号:粤B2-20090059 ![]() 粤公网安备44030502008569号
粤公网安备44030502008569号
腾讯云计算(北京)有限责任公司 京ICP证150476号 | 京ICP备11018762号