
熊猫中的散点图给出的值错误“c”参数必须是颜色、颜色序列或数字序列。
熊猫中的散点图给出的值错误“c”参数必须是颜色、颜色序列或数字序列。
提问于 2022-06-26 12:51:06
我写这个脚本是为了从附加的数据帧创建一个彩色映射的图。
这是代码
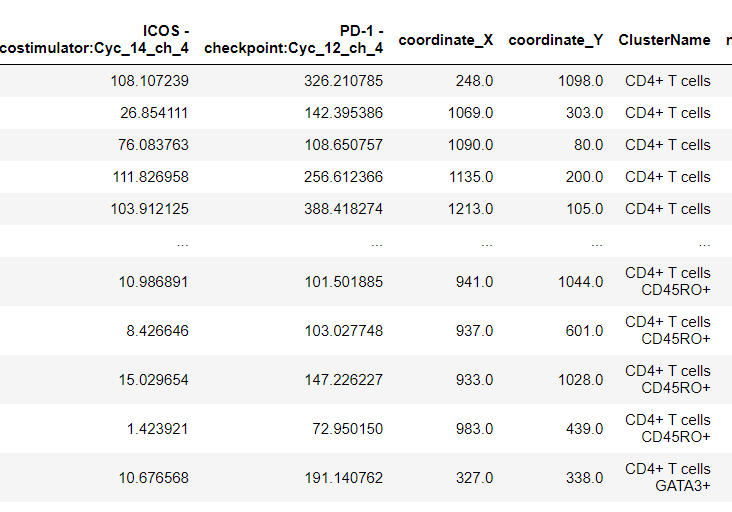
biaxial_plot_ICOS_PD1 = sorted_df.plot.scatter(x="ICOS - costimulator:Cyc_14_ch_4"
                                               , y="PD-1 - checkpoint:Cyc_12_ch_4"
                                               , c="ClusterName", colormap='viridis', s=50)
但我知道这个错误
ValueError: 'c' argument must be a color, a sequence of colors, or a sequence of numbers, not ['CD4+ T cells' 'CD4+ T cells' 'CD4+ T cells' ... 'CD4+ T cells CD45RO+' 'CD4+ T cells CD45RO+' 'CD4+ T cells GATA3+']sorted_df:
回答 1
Stack Overflow用户
回答已采纳
发布于 2022-06-26 13:14:52
当您向c参数提供列标签时,该列的值应该是有效的数字,根据所提供的颜色映射到颜色。来自docs of DataFrame.plot.scatter
c : str、int或类似数组的可选
每个点的颜色。可能的价值是:
- 由名称、RGB或RGBA代码引用的单个颜色字符串,例如“red”或“#a98d19”。
- 是由名称、RGB或RGBA代码引用的一系列颜色字符串,将递归地用于每个点的颜色。例如,“绿色”、“黄色”所有的点将被填充成绿色或黄色,alternatively.
- A列名或位置,其值将用于根据colormap.
对标记点进行着色。
c参数不直接解释为“本列的颜色”。如果您想要这样的东西,请使用seaborn。
在您的示例中,您似乎希望基于ClusterName对其进行着色,因此可以使用groupby + ngroup,以便将每个ClusterName映射到一个不同的整数,即不同的颜色。
这应该能行
cluster_colors = sorted_df.groupby('ClusterName').ngroup()
biaxial_plot_ICOS_PD1 = sorted_df.plot.scatter(x="ICOS - costimulator:Cyc_14_ch_4",
                                               y="PD-1 - checkpoint:Cyc_12_ch_4",
c=cluster_colors, colormap='viridis', s=50)页面原文内容由Stack Overflow提供。腾讯云小微IT领域专用引擎提供翻译支持
原文链接:
https://stackoverflow.com/questions/72761758
复制相关文章
相似问题
腾讯云开发者

Copyright © 2013 - 2026 Tencent Cloud. All Rights Reserved. 腾讯云 版权所有
深圳市腾讯计算机系统有限公司 ICP备案/许可证号:粤B2-20090059 ![]() 粤公网安备44030502008569号
粤公网安备44030502008569号
腾讯云计算(北京)有限责任公司 京ICP证150476号 | 京ICP备11018762号