
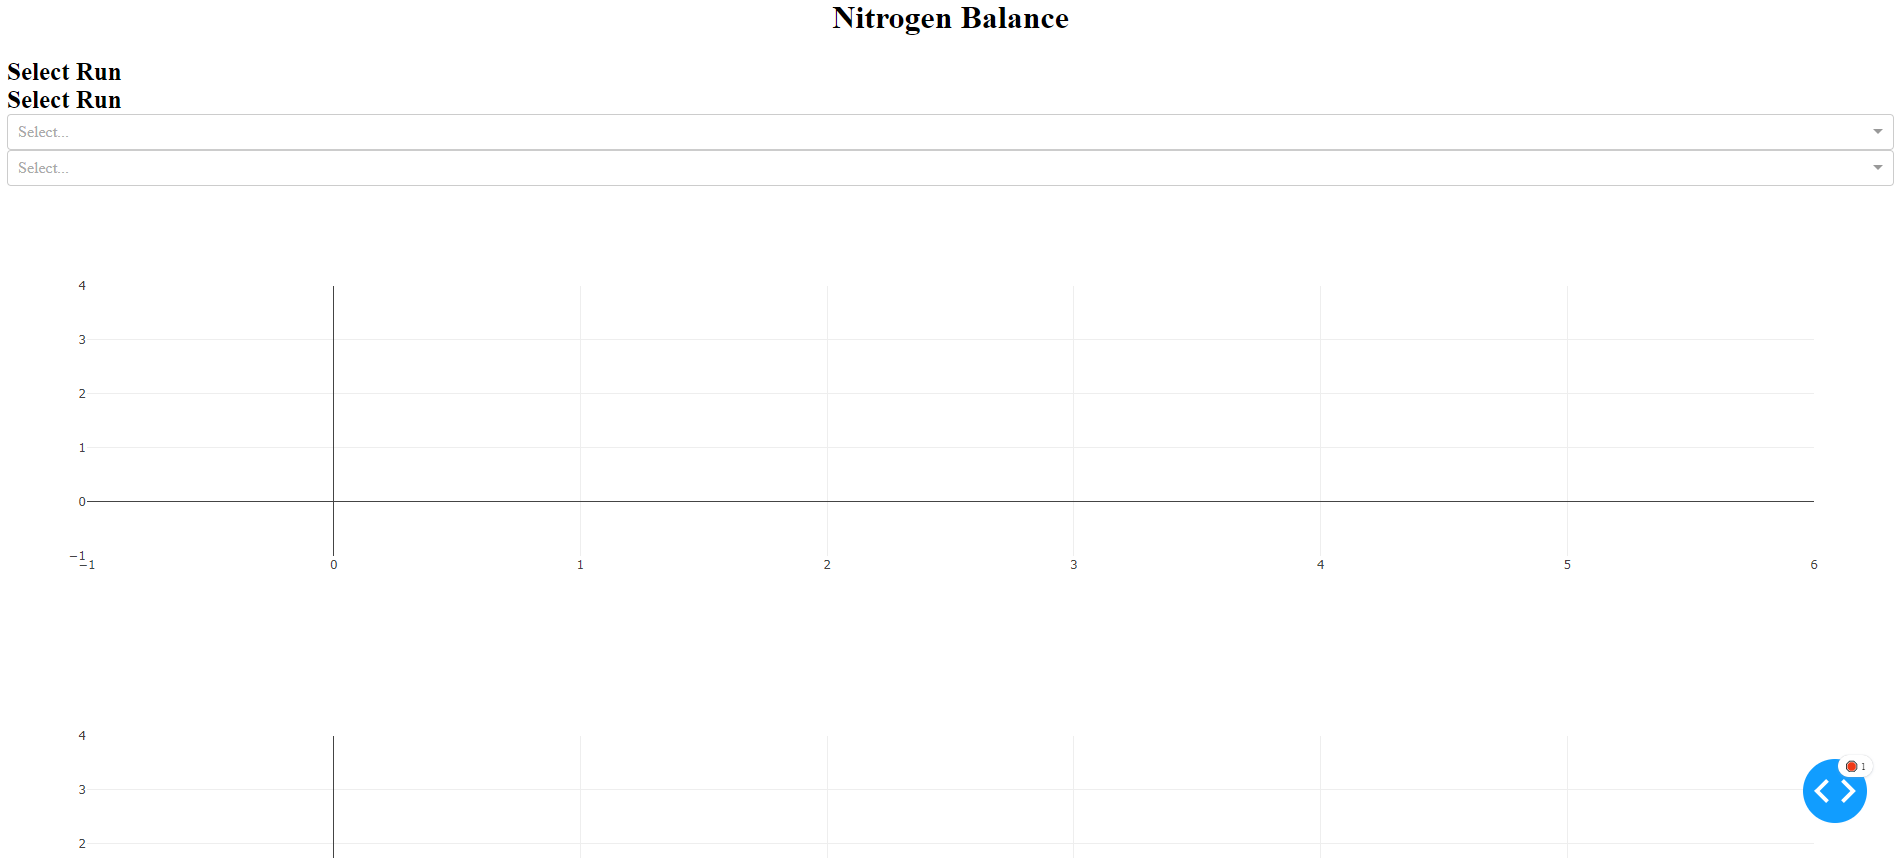
实际上,Dash:将标题放在每个下拉菜单的上方
出于某种原因,代码并不是在做应该做的事情,理想情况下,我希望标题、下拉列表和情节并排,但目前它是相互叠加的。
这是vestland提供的代码(再次感谢!)对于应用程序布局:
df_run_data = pd.DataFrame({'Hermes': {0: 'H11433-21', 1: 'H11433-21', 2: 'H11433-21', 3: 'H11433-21', 4: 'H11433-21', 5: 'H11433-21', 6: 'H11433-21', 7: 'H11433-22', 8: 'H11433-22', 9: 'H11433-22', 10: 'H11433-22', 11: 'H11433-22', 12: 'H11433-22', 13: 'H11433-22'}, 'Time': {0: 0.28, 1: 23.36, 2: 46.84, 3: 70.88, 4: 95.09, 5: 118.03, 6: 143.49, 7: 0.28, 8: 23.36, 9: 46.84, 10: 70.88, 11: 95.09, 12: 118.03, 13: 143.49}, 'Sample Type': {0: 'Broth', 1: 'Broth', 2: 'Broth', 3: 'Broth', 4: 'Broth', 5: 'Broth', 6: 'Broth', 7: 'Broth', 8: 'Broth', 9: 'Broth', 10: 'Broth', 11: 'Broth', 12: 'Broth', 13: 'Broth'}, 'Tank Weight Pre kg': {0: 0.249, 1: 0.254, 2: 0.318, 3: 0.389, 4:
0.383, 5: 0.354, 6: 0.356, 7: 0.249, 8: 0.254, 9: 0.318, 10: 0.389, 11: 0.383, 12: 0.354, 13: 0.356}, 'Tank Weight Post kg': {0: 0.243, 1: 0.235, 2: 0.249, 3: 0.251, 4: 0.25, 5: 0.25, 6: 0.277, 7: 0.243, 8: 0.235, 9: 0.249, 10: 0.251, 11: 0.25, 12: 0.25, 13: 0.277}})
runs = df_run_data.Hermes.unique()
headers = list(df_run_data.columns.values)

#how to use div https://stackoverflow.com/questions/62234909/layout-management-in-plotly-dash-app-how-to-position-html-div
app.layout = html.Div([

    dbc.Row([dbc.Col(html.H1('Nitrogen Balance', style = {'text-align': 'center'}))]),

    dbc.Row([dbc.Col(html.Label('Select Run',style={'font-weight': 'bold', "text-align": "start", 'font-size': 25}), width = 6, className = 'bg-primary ps-4'),
             dbc.Col(html.Label('Select Run',style={'font-weight': 'bold', "text-align": "start", 'font-size': 25}), width = 6, className = 'bg-primary ps-4')

            ], justify = 'start'),

    dbc.Row([dbc.Col([dcc.Dropdown(id='Hermes',
                    options=[{'label': i, 'value': i} for i in runs],   #df_run_data['Hermes']], #user will see this
                    value= None, #[i for i in df_run_data['Hermes']],  #default values to show runs
                    multi=True,
                    # style={'width':'40%','display': 'inline-block'}
                    )], width = 6, className = 'bg-secondary ps-4 pe-4'),

            dbc.Col([dcc.Dropdown(id='Columns',
                    options=[{'label': i, 'value': i} for i in headers],   #df_run_data['Hermes']], #user will see this
                    value= None, #[i for i in df_run_data['Hermes']],  #default values to show runs
                    multi=True,
                    # style={'width':'40%','display': 'inline-block'}
                    )], width = 6, className = 'bg-secondary ps-4 pe-4'),

            ], justify = 'start'
           ),
    html.Div(id ='output_container', children=[]),
    #html.Br(), #break here we want the space between divider and graph
    dbc.Row([dbc.Col([dcc.Graph(id='balance',figure={},
                    # style={'width': '80vh', 'height': '50vh'}
                    )], width = 6),
             dbc.Col([dcc.Graph(id='balance1',figure={},
                    # style={'width': '80vh', 'height': '50vh'}

                    )], width = 6)])

])回答 1
Stack Overflow用户
发布于 2022-06-26 22:13:12
简短答覆:
为了更好地控制Dash组件的定位,您应该考虑采用以下模式:
app.layout = hmtl.Div([dbc.Row([dbc.Col()])])或者在你的例子中,更像这样的东西:
app.layout = hmtl.Div([dbc.Row([<header>])
dbc.Row([dbc.Col([<label>]),
dbc.Col([<label>])]),
dbc.Row([dbc.Col([<dropdown>]),
dbc.Col([<dropdown>])]),
dbc.Row([dbc.Col([<graph>]),
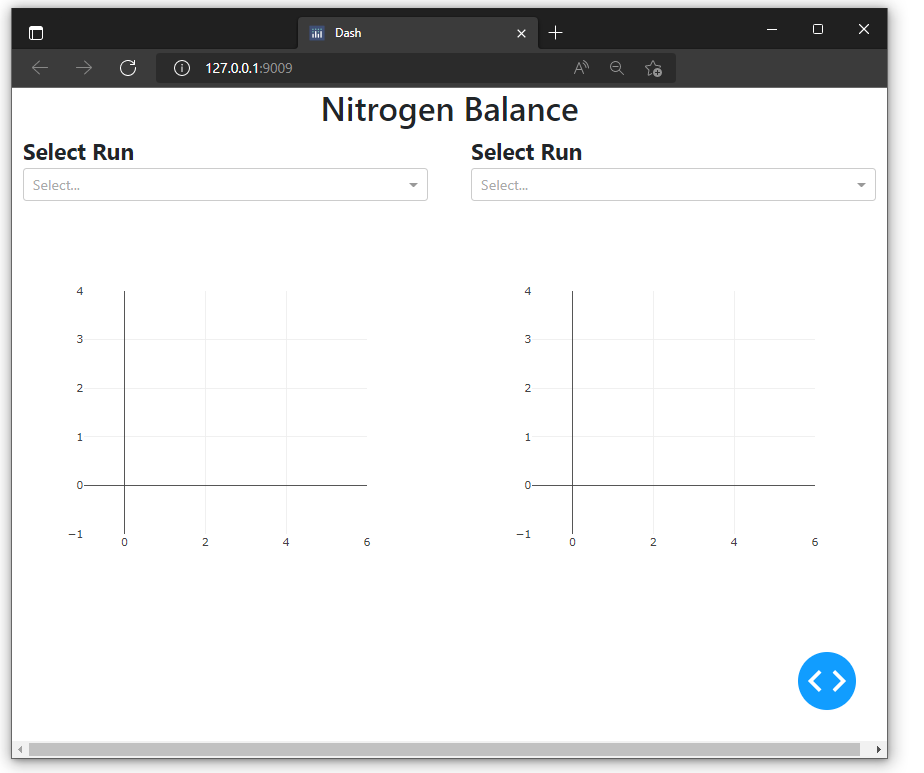
dbc.Col([<graph>])])])在下面的两个片段中,第一个应用程序生成了完整的详细信息:
详情如下:
这个贡献不会直接回答您所使用的特定组件的行为问题,但希望它能够解决根本问题,即在设计Plotly应用程序时让不同的组件协同工作。甚至可以为您提供一个平台,您可以在此平台上构建未来的Dash应用程序。
使用容器( dbc.Container或html.Div )构造Dash通常被认为是一种好做法,容器包含许多行( dbc.Row() ),而这些行又包含许多列( dbc.Col() ),这些列最终从一个或多个资源中保存了Plotly组件:
from dash import Dash, html, dcc
import dash_bootstrap_components as dbc这种方法允许您将任何组件精确定位到您想要的位置。通过使用Style或className进行微调,您可以使不同的组件具有不同的特性,并使缺省值对齐并表现良好。
例如,如下所示:
App /代码输出1

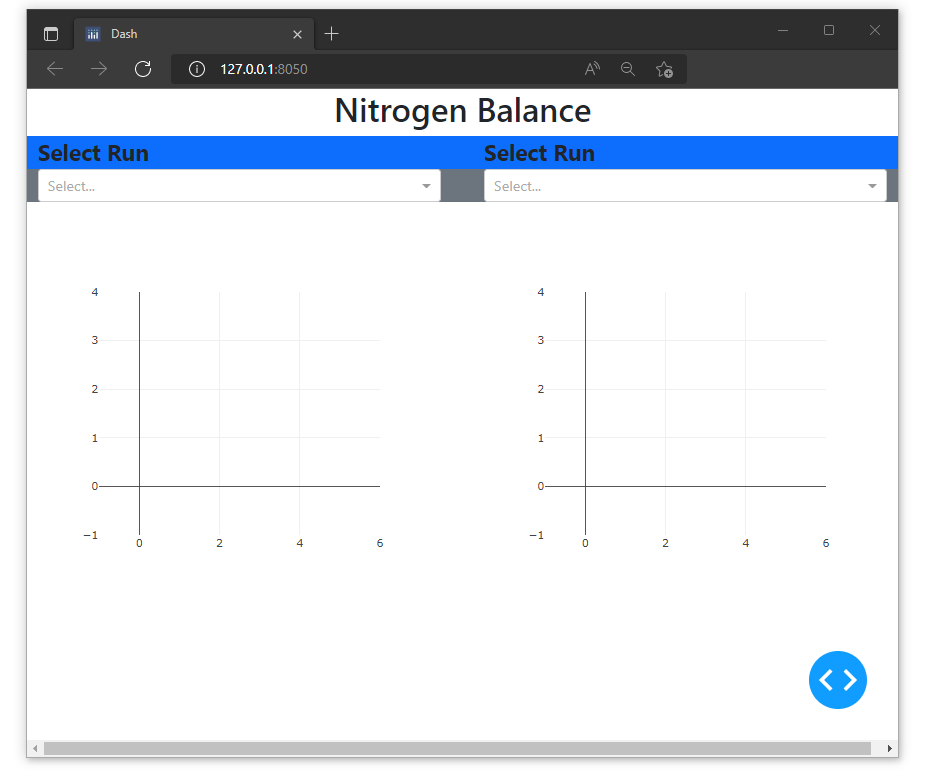
从这里开始,如果您想知道每个组件的起始、结束和对齐位置,您可以使用例如className='bg-primary'来装饰它们,并得到以下内容:
App /代码输出2
代码片段1
from jupyter_dash import JupyterDash
from dash import Dash, html, dcc
import dash_bootstrap_components as dbc
import pandas as pd
import plotly.express as px

app = Dash(external_stylesheets=[dbc.themes.BOOTSTRAP])

surfacing = pd.DataFrame({'Barcode':[1,2,3],
                         'Machine':[3,2,1]})

coating = pd.DataFrame({'Barcode':[1,2,3],
                         'Machine':[3,2,1]})

runs = ['A', 'B']
headers = ['A', 'B']

app.layout = html.Div([
    dbc.Row([dbc.Col(html.H1('Nitrogen Balance', style = {'text-align': 'center'}))]),

    dbc.Row([dbc.Col(html.Label('Select Run',style={'font-weight': 'bold', "text-align": "start", 'font-size': 25}), width = 6, className = 'bg-primary ps-4'),
             dbc.Col(html.Label('Select Run',style={'font-weight': 'bold', "text-align": "start", 'font-size': 25}), width = 6, className = 'bg-primary ps-4')

            ], justify = 'start'),

    dbc.Row([dbc.Col([dcc.Dropdown(id='Hermes',
                            options=[{'label': i, 'value': i} for i in runs],   #df_run_data['Hermes']], #user will see this
                            value= None, #[i for i in df_run_data['Hermes']],  #default values to show runs
                            multi=True,
                            # style={'width':'40%','display': 'inline-block'}
                            )], width = 6, className = 'bg-secondary ps-4 pe-4'),

            dbc.Col([dcc.Dropdown(id='Columns',
                            options=[{'label': i, 'value': i} for i in headers],   #df_run_data['Hermes']], #user will see this
                            value= None, #[i for i in df_run_data['Hermes']],  #default values to show runs
                            multi=True,
                            # style={'width':'40%','display': 'inline-block'}
                            )], width = 6, className = 'bg-secondary ps-4 pe-4'),

            ], justify = 'start'
           ),
    dbc.Row([dbc.Col([dcc.Graph(id='balance',figure={},
                                # style={'width': '80vh', 'height': '50vh'}
                               )], width = 6),
             dbc.Col([dcc.Graph(id='balance1',figure={},
                                # style={'width': '80vh', 'height': '50vh'}

                               )], width = 6)])

])


app.run_server(debug=True)
代码片段2
from jupyter_dash import JupyterDash
from dash import Dash, html, dcc
import dash_bootstrap_components as dbc
import pandas as pd
import plotly.express as px

app = JupyterDash(external_stylesheets=[dbc.themes.BOOTSTRAP])

surfacing = pd.DataFrame({'Barcode':[1,2,3],
                         'Machine':[3,2,1]})

coating = pd.DataFrame({'Barcode':[1,2,3],
                         'Machine':[3,2,1]})

runs = ['A', 'B']
headers = ['A', 'B']

app.layout = html.Div([
    dbc.Row([dbc.Col(html.H1('Nitrogen Balance', style = {'text-align': 'center'}))]),

    dbc.Row([dbc.Col(html.Label('Select Run',style={'font-weight': 'bold', "text-align": "start", 'font-size': 25}), width = 6, className = 'ps-4'),
             dbc.Col(html.Label('Select Run',style={'font-weight': 'bold', "text-align": "start", 'font-size': 25}), width = 6, className = 'ps-4')

            ], justify = 'start'),

    dbc.Row([dbc.Col([dcc.Dropdown(id='Hermes',
                            options=[{'label': i, 'value': i} for i in runs],   #df_run_data['Hermes']], #user will see this
                            value= None, #[i for i in df_run_data['Hermes']],  #default values to show runs
                            multi=True,
                            # style={'width':'40%','display': 'inline-block'}
                            )], width = 6, className = 'ps-4 pe-4'),

            dbc.Col([dcc.Dropdown(id='Columns',
                            options=[{'label': i, 'value': i} for i in headers],   #df_run_data['Hermes']], #user will see this
                            value= None, #[i for i in df_run_data['Hermes']],  #default values to show runs
                            multi=True,
                            # style={'width':'40%','display': 'inline-block'}
                            )], width = 6, className = 'ps-4 pe-4'),

            ], justify = 'start'
           ),
    dbc.Row([dbc.Col([dcc.Graph(id='balance',figure={},
                                # style={'width': '80vh', 'height': '50vh'}
                               )], width = 6),
             dbc.Col([dcc.Graph(id='balance1',figure={},
                                # style={'width': '80vh', 'height': '50vh'}

                               )], width = 6)])

])


app.run_server(debug=True)https://stackoverflow.com/questions/72723199
复制相似问题
腾讯云开发者

Copyright © 2013 - 2026 Tencent Cloud. All Rights Reserved. 腾讯云 版权所有
深圳市腾讯计算机系统有限公司 ICP备案/许可证号:粤B2-20090059 ![]() 粤公网安备44030502008569号
粤公网安备44030502008569号
腾讯云计算(北京)有限责任公司 京ICP证150476号 | 京ICP备11018762号