
如何在R中用ggplot2中的一个标签按组合并特定的状态?
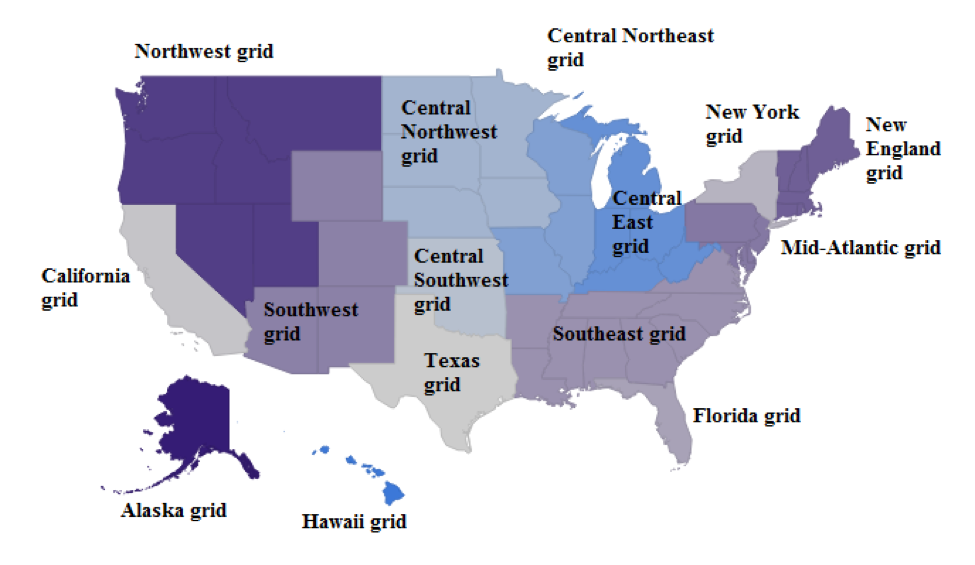
我要绘制美国的电网地图,所以我需要把特定的州合并在一起。我想把这些州的边界划在一起,但这行不通。每组也只有一个标签。这是我的数据: https://iastate.box.com/s/12xru62lvmbbkrohsn7b4wwexq11umn7,这是我的代码:
# Join and arrange
 states <- us_map(exclude = c("AK", "HI"))
 states_data <- left_join(states, myinput, by = c("abbr" = "region")) |>
 arrange(emission, growth, group, order)

ggplot(states_data, aes(x, y, fill = value, group = group, subgroup = grid)) +
geom_polygon()+
scale_fill_continuous(low = "white", high = "red", name = "Ele gen (EJ)", label =
scales::comma) +
facet_grid(emission~growth) +
coord_equal() +
ggthemes::theme_map() +
theme(legend.position = "bottom")+
geom_text(aes(x, y, label = grid),size = 5,family = "serif",
        data = states_data, vjust = 1.2, nudge_y = -100000,check_overlap = T)+
geom_polygon(aes(color = "Border", group=grid),fill = NA,color = "black")
这不是我中间的输出:
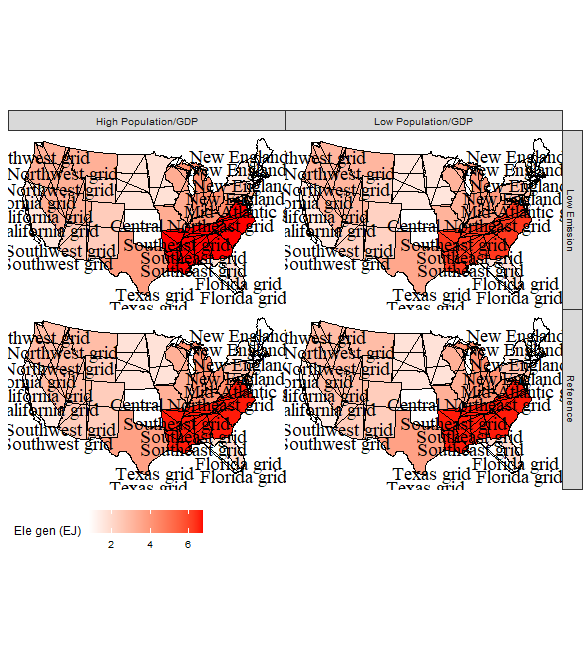
我想要绘制这些区域(加上要指定的边框,因为我不能用不同的颜色显示它们)
数据
structure(list(region = c("AL", "AR", "AZ", "CA", "CO", "CT",
"DC", "DE", "FL", "GA", "IA", "ID", "IL", "IN", "KS", "KY", "LA",
"MA", "MD", "ME", "MI", "MN", "MO", "MS", "MT", "NC", "ND", "NE",
"NH", "NJ", "NM", "NV", "NY", "OH", "OK", "OR", "PA", "RI", "SC",
"SD", "TN", "TX", "UT", "VA", "VT", "WA", "WI", "WV", "WY", "AL",
"AR", "AZ", "CA", "CO", "CT", "DC", "DE", "FL", "GA", "IA", "ID",
"IL", "IN", "KS", "KY", "LA", "MA", "MD", "ME", "MI", "MN", "MO",
"MS", "MT", "NC", "ND", "NE", "NH", "NJ", "NM", "NV", "NY", "OH",
"OK", "OR", "PA", "RI", "SC", "SD", "TN", "TX", "UT", "VA", "VT",
"WA", "WI", "WV", "WY", "AL", "AR", "AZ", "CA", "CO", "CT", "DC",
"DE", "FL", "GA", "IA", "ID", "IL", "IN", "KS", "KY", "LA", "MA",
"MD", "ME", "MI", "MN", "MO", "MS", "MT", "NC", "ND", "NE", "NH",
"NJ", "NM", "NV", "NY", "OH", "OK", "OR", "PA", "RI", "SC", "SD",
"TN", "TX", "UT", "VA", "VT", "WA", "WI", "WV", "WY", "AL", "AR",
"AZ", "CA", "CO", "CT", "DC", "DE", "FL", "GA", "IA", "ID", "IL",
"IN", "KS", "KY", "LA", "MA", "MD", "ME", "MI", "MN", "MO", "MS",
"MT", "NC", "ND", "NE", "NH", "NJ", "NM", "NV", "NY", "OH", "OK",
"OR", "PA", "RI", "SC", "SD", "TN", "TX", "UT", "VA", "VT", "WA",
"WI", "WV", "WY"), value = c(6.22256321333333, 6.22256321333333,
2.20794523906666, 1.49034165333333, 2.20794523906666, 0.826546816817333,
2.61905459786667, 2.61905459786667, 1.65110329, 6.22256321333333,
1.59528739166667, 3.0363665376, 3.13763399333332, 3.865420576,
0.790624669333333, 3.865420576, 6.22256321333333, 0.826546816817333,
2.61905459786667, 0.826546816817333, 3.865420576, 1.59528739166667,
3.13763399333332, 6.22256321333333, 3.0363665376, 6.22256321333333,
1.59528739166667, 1.59528739166667, 0.826546816817333, 2.61905459786667,
2.20794523906666, 3.0363665376, 1.21040939333333, 3.865420576,
0.790624669333333, 3.0363665376, 2.61905459786667, 0.826546816817333,
6.22256321333333, 1.59528739166667, 6.22256321333333, 3.50149982333333,
3.0363665376, 6.22256321333333, 0.826546816817333, 3.0363665376,
3.13763399333332, 3.865420576, 2.20794523906666, 6.58823506033333,
6.58823506033333, 2.33729970666667, 1.35043392, 2.33729970666667,
0.7918773089276, 2.64941819863333, 2.64941819863333, 1.84968858666667,
6.58823506033333, 1.69423596966667, 2.82831107136667, 3.22375391666666,
4.14114214399999, 0.816646300333333, 4.14114214399999, 6.58823506033333,
0.7918773089276, 2.64941819863333, 0.7918773089276, 4.14114214399999,
1.69423596966667, 3.22375391666666, 6.58823506033333, 2.82831107136667,
6.58823506033333, 1.69423596966667, 1.69423596966667, 0.7918773089276,
2.64941819863333, 2.33729970666667, 2.82831107136667, 1.15469864333333,
4.14114214399999, 0.816646300333333, 2.82831107136667, 2.64941819863333,
0.7918773089276, 6.58823506033333, 1.69423596966667, 6.58823506033333,
3.66557223, 2.82831107136667, 6.58823506033333, 0.7918773089276,
2.82831107136667, 3.22375391666666, 4.14114214399999, 2.33729970666667,
6.72966092166666, 6.72966092166666, 2.3737108016, 1.58503659,
2.3737108016, 0.884016546345666, 2.8041352651, 2.8041352651,
1.73653393333333, 6.72966092166666, 1.73917558366667, 3.23410557176666,
3.34795298333333, 4.19485727566666, 0.859289106, 4.19485727566666,
6.72966092166666, 0.884016546345666, 2.8041352651, 0.884016546345666,
4.19485727566666, 1.73917558366667, 3.34795298333333, 6.72966092166666,
3.23410557176666, 6.72966092166666, 1.73917558366667, 1.73917558366667,
0.884016546345666, 2.8041352651, 2.3737108016, 3.23410557176666,
1.28265139333333, 4.19485727566666, 0.859289106, 3.23410557176666,
2.8041352651, 0.884016546345666, 6.72966092166666, 1.73917558366667,
6.72966092166666, 3.79724887666667, 3.23410557176666, 6.72966092166666,
0.884016546345666, 3.23410557176666, 3.34795298333333, 4.19485727566666,
2.3737108016, 6.58823506033333, 6.58823506033333, 2.33729970666667,
1.35043392, 2.33729970666667, 0.7918773089276, 2.64941819863333,
2.64941819863333, 1.84968858666667, 6.58823506033333, 1.69423596966667,
2.82831107136667, 3.22375391666666, 4.14114214399999, 0.816646300333333,
4.14114214399999, 6.58823506033333, 0.7918773089276, 2.64941819863333,
0.7918773089276, 4.14114214399999, 1.69423596966667, 3.22375391666666,
6.58823506033333, 2.82831107136667, 6.58823506033333, 1.69423596966667,
1.69423596966667, 0.7918773089276, 2.64941819863333, 2.33729970666667,
2.82831107136667, 1.15469864333333, 4.14114214399999, 0.816646300333333,
2.82831107136667, 2.64941819863333, 0.7918773089276, 6.58823506033333,
1.69423596966667, 6.58823506033333, 3.66557223, 2.82831107136667,
6.58823506033333, 0.7918773089276, 2.82831107136667, 3.22375391666666,
4.14114214399999, 2.33729970666667), grid = c("Southeast grid",
"Southeast grid", "Southwest grid", "California grid", "Southwest grid",
"New England grid", "Mid-Atlantic grid", "Mid-Atlantic grid",
"Florida grid", "Southeast grid", "Central Northwest grid", "Northwest grid",
"Central Northeast grid", "Central East grid", "Central Southwest grid",
"Central East grid", "Southeast grid", "New England grid", "Mid-Atlantic grid",
"New England grid", "Central East grid", "Central Northwest grid",
"Central Northeast grid", "Southeast grid", "Northwest grid",
"Southeast grid", "Central Northwest grid", "Central Northwest grid",
"New England grid", "Mid-Atlantic grid", "Southwest grid", "Northwest grid",
"New York grid", "Central East grid", "Central Southwest grid",
"Northwest grid", "Mid-Atlantic grid", "New England grid", "Southeast grid",
"Central Northwest grid", "Southeast grid", "Texas grid", "Northwest grid",
"Southeast grid", "New England grid", "Northwest grid", "Central Northeast grid",
"Central East grid", "Southwest grid", "Southeast grid", "Southeast grid",
"Southwest grid", "California grid", "Southwest grid", "New England grid",
"Mid-Atlantic grid", "Mid-Atlantic grid", "Florida grid", "Southeast grid",
"Central Northwest grid", "Northwest grid", "Central Northeast grid",
"Central East grid", "Central Southwest grid", "Central East grid",
"Southeast grid", "New England grid", "Mid-Atlantic grid", "New England grid",
"Central East grid", "Central Northwest grid", "Central Northeast grid",
"Southeast grid", "Northwest grid", "Southeast grid", "Central Northwest grid",
"Central Northwest grid", "New England grid", "Mid-Atlantic grid",
"Southwest grid", "Northwest grid", "New York grid", "Central East grid",
"Central Southwest grid", "Northwest grid", "Mid-Atlantic grid",
"New England grid", "Southeast grid", "Central Northwest grid",
"Southeast grid", "Texas grid", "Northwest grid", "Southeast grid",
"New England grid", "Northwest grid", "Central Northeast grid",
"Central East grid", "Southwest grid"), emission = c("Low Emission",
"Low Emission", "Low Emission", "Low Emission", "Low Emission",
"Low Emission", "Low Emission", "Low Emission", "Low Emission",
"Low Emission", "Low Emission", "Low Emission", "Low Emission",
"Low Emission", "Low Emission", "Low Emission", "Low Emission",
"Low Emission", "Low Emission", "Low Emission", "Low Emission",
"Low Emission", "Low Emission", "Low Emission", "Low Emission",
"Low Emission", "Low Emission", "Low Emission", "Low Emission",
"Low Emission", "Low Emission", "Low Emission", "Low Emission",
"Low Emission", "Low Emission", "Low Emission", "Low Emission",
"Low Emission", "Low Emission", "Low Emission", "Low Emission",
"Low Emission", "Low Emission", "Low Emission", "Low Emission",
"Low Emission", "Low Emission", "Low Emission", "Low Emission",
"Reference", "Reference", "Reference", "Reference", "Reference",
"Reference", "Reference", "Reference", "Reference", "Reference",
"Reference", "Reference", "Reference", "Reference", "Reference",
"Reference", "Reference", "Reference", "Reference", "Reference",
"Reference", "Reference", "Reference", "Reference", "Reference",
"Reference", "Reference", "Reference", "Reference", "Reference",
"Reference", "Reference", "Reference", "Reference", "Reference",
"Reference", "Reference", "Reference", "Reference", "Reference",
"Reference", "Reference", "Reference", "Reference", "Reference",
"Reference", "Reference", "Reference", "Reference", "Low Emission",
"Low Emission", "Low Emission", "Low Emission", "Low Emission",
"Low Emission", "Low Emission", "Low Emission", "Low Emission",
"Low Emission", "Low Emission", "Low Emission", "Low Emission",
"Low Emission", "Low Emission", "Low Emission", "Low Emission",
"Low Emission", "Low Emission", "Low Emission", "Low Emission",
"Low Emission", "Low Emission", "Low Emission", "Low Emission",
"Low Emission", "Low Emission", "Low Emission", "Low Emission",
"Low Emission", "Low Emission", "Low Emission", "Low Emission",
"Low Emission", "Low Emission", "Low Emission", "Low Emission",
"Low Emission", "Low Emission", "Low Emission", "Low Emission",
"Low Emission", "Low Emission", "Low Emission", "Low Emission",
"Low Emission", "Low Emission", "Low Emission", "Low Emission",
"Reference", "Reference", "Reference", "Reference", "Reference",
"Reference", "Reference", "Reference", "Reference", "Reference",
"Reference", "Reference", "Reference", "Reference", "Reference",
"Reference", "Reference", "Reference", "Reference", "Reference",
"Reference", "Reference", "Reference", "Reference", "Reference",
"Reference", "Reference", "Reference", "Reference", "Reference",
"Reference", "Reference", "Reference", "Reference", "Reference",
"Reference", "Reference", "Reference", "Reference", "Reference",
"Reference", "Reference", "Reference", "Reference", "Reference",
"Reference", "Reference", "Reference", "Reference"), growth = c("Low Population/GDP",
"Low Population/GDP", "Low Population/GDP", "Low Population/GDP",
"Low Population/GDP", "Low Population/GDP", "Low Population/GDP",
"Low Population/GDP", "Low Population/GDP", "Low Population/GDP",
"Low Population/GDP", "Low Population/GDP", "Low Population/GDP",
"Low Population/GDP", "Low Population/GDP", "Low Population/GDP",
"Low Population/GDP", "Low Population/GDP", "Low Population/GDP",
"Low Population/GDP", "Low Population/GDP", "Low Population/GDP",
"Low Population/GDP", "Low Population/GDP", "Low Population/GDP",
"Low Population/GDP", "Low Population/GDP", "Low Population/GDP",
"Low Population/GDP", "Low Population/GDP", "Low Population/GDP",
"Low Population/GDP", "Low Population/GDP", "Low Population/GDP",
"Low Population/GDP", "Low Population/GDP", "Low Population/GDP",
"Low Population/GDP", "Low Population/GDP", "Low Population/GDP",
"Low Population/GDP", "Low Population/GDP", "Low Population/GDP",
"Low Population/GDP", "Low Population/GDP", "Low Population/GDP",
"Low Population/GDP", "Low Population/GDP", "Low Population/GDP",
"Low Population/GDP", "Low Population/GDP", "Low Population/GDP",
"Low Population/GDP", "Low Population/GDP", "Low Population/GDP",
"Low Population/GDP", "Low Population/GDP", "Low Population/GDP",
"Low Population/GDP", "Low Population/GDP", "Low Population/GDP",
"Low Population/GDP", "Low Population/GDP", "Low Population/GDP",
"Low Population/GDP", "Low Population/GDP", "Low Population/GDP",
"Low Population/GDP", "Low Population/GDP", "Low Population/GDP",
"Low Population/GDP", "Low Population/GDP", "Low Population/GDP",
"Low Population/GDP", "Low Population/GDP", "Low Population/GDP",
"Low Population/GDP", "Low Population/GDP", "Low Population/GDP",
"Low Population/GDP", "Low Population/GDP", "Low Population/GDP",
"Low Population/GDP", "Low Population/GDP", "Low Population/GDP",
"Low Population/GDP", "Low Population/GDP", "Low Population/GDP",
"Low Population/GDP", "Low Population/GDP", "Low Population/GDP",
"Low Population/GDP", "Low Population/GDP", "Low Population/GDP",
"Low Population/GDP", "Low Population/GDP", "Low Population/GDP",
"Low Population/GDP", "High Population/GDP", "High Population/GDP",
"High Population/GDP", "High Population/GDP", "High Population/GDP",
"High Population/GDP", "High Population/GDP", "High Population/GDP",
"High Population/GDP", "High Population/GDP", "High Population/GDP",
"High Population/GDP", "High Population/GDP", "High Population/GDP",
"High Population/GDP", "High Population/GDP", "High Population/GDP",
"High Population/GDP", "High Population/GDP", "High Population/GDP",
"High Population/GDP", "High Population/GDP", "High Population/GDP",
"High Population/GDP", "High Population/GDP", "High Population/GDP",
"High Population/GDP", "High Population/GDP", "High Population/GDP",
"High Population/GDP", "High Population/GDP", "High Population/GDP",
"High Population/GDP", "High Population/GDP", "High Population/GDP",
"High Population/GDP", "High Population/GDP", "High Population/GDP",
"High Population/GDP", "High Population/GDP", "High Population/GDP",
"High Population/GDP", "High Population/GDP", "High Population/GDP",
"High Population/GDP", "High Population/GDP", "High Population/GDP",
"High Population/GDP", "High Population/GDP", "High Population/GDP",
"High Population/GDP", "High Population/GDP", "High Population/GDP",
"High Population/GDP", "High Population/GDP", "High Population/GDP",
"High Population/GDP", "High Population/GDP", "High Population/GDP",
"High Population/GDP", "High Population/GDP", "High Population/GDP",
"High Population/GDP", "High Population/GDP", "High Population/GDP",
"High Population/GDP", "High Population/GDP", "High Population/GDP",
"High Population/GDP", "High Population/GDP", "High Population/GDP",
"High Population/GDP", "High Population/GDP", "High Population/GDP",
"High Population/GDP", "High Population/GDP", "High Population/GDP",
"High Population/GDP", "High Population/GDP", "High Population/GDP",
"High Population/GDP", "High Population/GDP", "High Population/GDP",
"High Population/GDP", "High Population/GDP", "High Population/GDP",
"High Population/GDP", "High Population/GDP", "High Population/GDP",
"High Population/GDP", "High Population/GDP", "High Population/GDP",
"High Population/GDP", "High Population/GDP", "High Population/GDP",
"High Population/GDP", "High Population/GDP", "High Population/GDP"
)), class = c("tbl_df", "tbl", "data.frame"), row.names = c(NA,
-196L))回答 2
Stack Overflow用户
发布于 2022-06-22 07:12:42
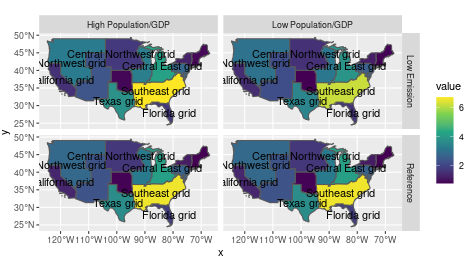
您需要使用shapefile/简单特性sf对象,而不仅仅是数据帧。
usmap软件包是一个高级别的软件包,目的是方便地制作标准的美国地图。它不附带shapefile,但包含实际数据帧中的多边形数据(由usmapdata包提供)。此包不方便自定义状态合并。
在数据帧中合并多边形并不是不可能的,但这并不容易。它也将重新发明车轮,因为sf包是为类似这样的东西而构建的。但它只适用于shapefiles / sf对象。
好消息是,在R世界中,美国不是一个不受欢迎的国家,还有其他包含美国地图数据的R包,比如带有shapefiles的USAboundaries。
sf包允许您很容易地合并(这里这个过程称为联合)多边形,例如简单的总结。(见下文)。
然后,您可以使用ggplot2 2非常自己的geom_sf来表示统一的多边形,使用geom_sf_text或geom_sf_label作为标签。
代码中的进一步注释。
library(tidyverse)
## use for example this for US shapefile maps
library(USAboundaries)
## you will need the sf package for some stuff
library(sf)
# my_data <- ... from your question above
states <- us_states()
states <- states[!states$name %in% c("Alaska", "Hawaii"),]
##remove arrange
states_data <- left_join(states, my_data, by = c("state_abbr" = "region" )) %>%
## there is an NA value that needs removal
drop_na(grid)
## this is to unionise the polygons
custom_grids <-
states_data %>%
## group by all the variables that occur in the facets
group_by(grid, emission, growth) %>%
summarise(value = mean(value))
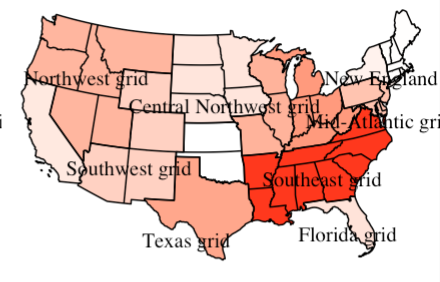
## you can now plot the unionised polygon sf object with geom_sf and geom_sf_text for labels
ggplot(custom_grids) +
geom_sf(aes(fill = value)) +
geom_sf_text(aes(label = grid), check_overlap = T)+
scale_fill_viridis_c() +
facet_grid(emission~growth)
Stack Overflow用户
发布于 2022-06-22 05:50:42
我找不到一个非常简单的方法来实现这一点,但我可以帮你做到这一点。
首先,我计算了每个组和面的中位数x和y。
mm <- states_data %>%
  group_by(growth, emission, grid) %>%
summarise(x = median(x), y = median(y))然后,我查找与这些坐标相匹配的最接近的行数据行,以放置标签。我创建了一个函数,一个NA向量(待更新),然后遍历每个中介,在数据(states_data)中找到相应的行。这将为数据创建另一列,但网格字符串仅位于被标识为每个网格的准中心的行中。
mdist <- function(mm, df1) { #vector mm contains medians; df1 contains points to compare
  x = mm$x
  y = mm$y
  df2 <- df1 %>% mutate(rn = 1:nrow(.)) %>%
    filter(grid == mm$grid, growth == mm$growth, emission == mm$emission)
  df3 <- data.frame(V1 = sqrt((abs(df2$x) - abs(x))^2 + (abs(df2$y) - abs(y))^2),
                    rn = df2$rn,
                    grid = mm$grid) %>%
    filter(V1 == min(V1))
  return(df3[1, ])
}

arr <- rep(NA, nrow(states_data))
invisible(
  map(1:nrow(mm),
      function(j) {
        gimme <- mdist(mm[j, ], states_data)
        arr[gimme$rn] <<- gimme$grid
}))现在,这个列grid2用于标签。
我注意到你在呼唤ggplot时有分组和分组。然而,你的分组比组有更多的划分,这就是导致涂鸦的原因(因为没有更好的词)。这就是我的意思:
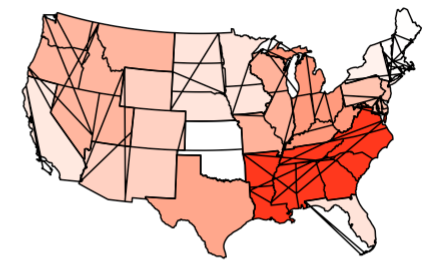
出于这个原因,我在ggplot中切换了组/子组调用。(你可能想要这样做,所以我只想解释一下我做了什么和为什么要做。)
我还注意到,您的网格位于文本的顶部,颜色相同,这会淹没单词。您使用了nudge_y,但我认为hjust也可能会给您带来更大的冲击。
这就是我所用的:
ggplot(states_data, aes(x, y, fill = value, subgroup = group, group = grid)) +
  geom_polygon()+
  scale_fill_continuous(low = "white", high = "red", name = "Ele gen (EJ)", label =
                          scales::comma) +
  facet_grid(emission~growth) +
  coord_equal() +
  ggthemes::theme_map() +
  theme(legend.position = "bottom") +
  geom_polygon(aes(color = "Border", group = grid),fill = NA, color = "lightgray") +
  geom_text(aes(label = grid2),size = 4, family = "serif", fontface = "bold",
            data = states_data, vjust = 1.2, hjust = .5, check_overlap = T)
这并不完美。你说得对-大多数标签还在“页面”之外。然而,这应该会让你朝着正确的方向前进。
https://stackoverflow.com/questions/72708323
复制相似问题
腾讯云开发者

Copyright © 2013 - 2026 Tencent Cloud. All Rights Reserved. 腾讯云 版权所有
深圳市腾讯计算机系统有限公司 ICP备案/许可证号:粤B2-20090059 ![]() 粤公网安备44030502008569号
粤公网安备44030502008569号
腾讯云计算(北京)有限责任公司 京ICP证150476号 | 京ICP备11018762号