
如何利用hvPlot改变图幅上方标签的位置
如何利用hvPlot改变图幅上方标签的位置
提问于 2022-06-21 17:09:26
通过将hvplot.labels()与text_align='left'一起使用,我可以将标签位置改为右转如下:
import hvplot.pandas
import pandas as pd
df = pd.DataFrame(
    {'City': ['Buenos Aires', 'Brasilia', 'Santiago', 'Bogota', 'Caracas'],
     'Country': ['Argentina', 'Brazil', 'Chile', 'Colombia', 'Venezuela'],
     'Latitude': [-34.58, -15.78, -33.45, 4.60, 10.48],
     'Longitude': [-58.66, -47.91, -70.66, -74.08, -66.86]})
df.hvplot.points(x='Longitude', y='Latitude', padding=0.2, hover_cols='all', width=300) * \
df.hvplot.labels(x='Longitude', y='Latitude', text='City',
text_align='left', hover=False).opts(text_font_size='7pt')
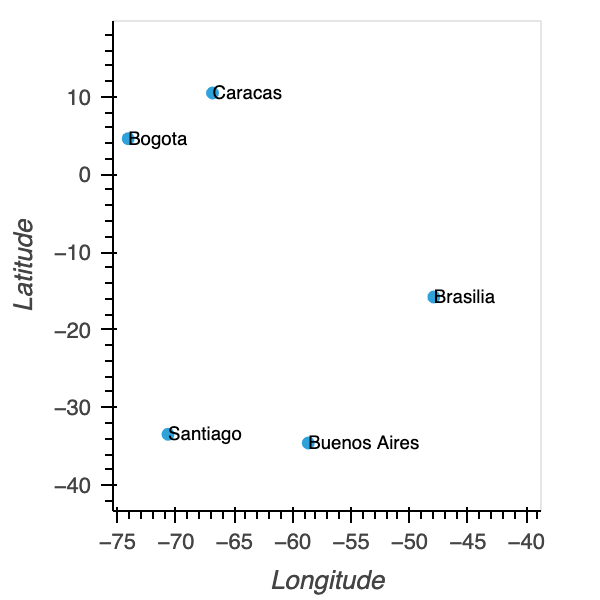
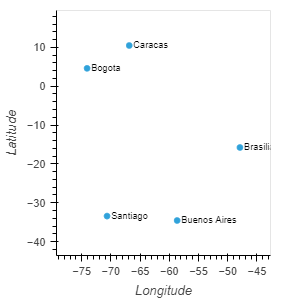
但是标签仍然与圆号重叠,所以我想把它们移到右边。怎样才能得到下面的图表?现在,我唯一能想到的方法就是在标签的开头添加一个空格.
回答 1
Stack Overflow用户
回答已采纳
发布于 2022-06-21 17:28:10
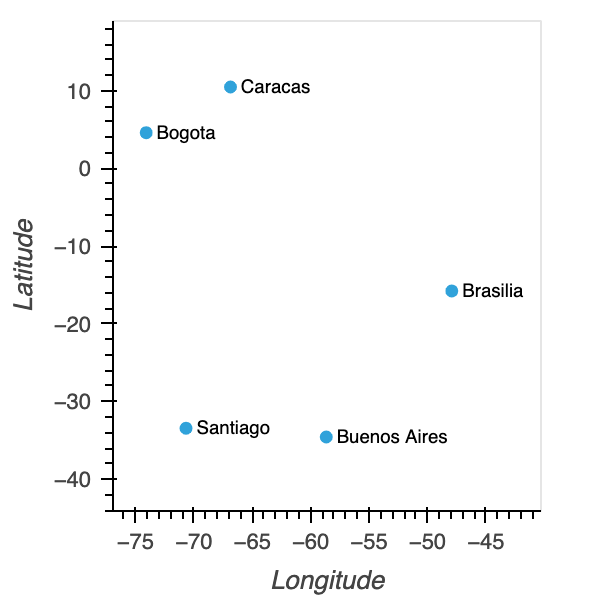
在最后一行中,在opts()中,您可以添加xoffset=0.7,这应该会将标签移到右边。下面是更新的代码和绘图。
import hvplot.pandas
import pandas as pd
df = pd.DataFrame(
    {'City': ['Buenos Aires', 'Brasilia', 'Santiago', 'Bogota', 'Caracas'],
     'Country': ['Argentina', 'Brazil', 'Chile', 'Colombia', 'Venezuela'],
     'Latitude': [-34.58, -15.78, -33.45, 4.60, 10.48],
     'Longitude': [-58.66, -47.91, -70.66, -74.08, -66.86]})
df.hvplot.points(x='Longitude', y='Latitude', padding=0.2, hover_cols='all', width=300) * \
df.hvplot.labels(x='Longitude', y='Latitude', text='City',
text_align='left', hover=False).opts(xoffset=0.7, text_font_size='7pt')
输出图
页面原文内容由Stack Overflow提供。腾讯云小微IT领域专用引擎提供翻译支持
原文链接:
https://stackoverflow.com/questions/72704658
复制相关文章
相似问题
腾讯云开发者

Copyright © 2013 - 2026 Tencent Cloud. All Rights Reserved. 腾讯云 版权所有
深圳市腾讯计算机系统有限公司 ICP备案/许可证号:粤B2-20090059 ![]() 粤公网安备44030502008569号
粤公网安备44030502008569号
腾讯云计算(北京)有限责任公司 京ICP证150476号 | 京ICP备11018762号