
如何用sns.boxplot或sns.catplot在盒图中添加哈茨
如何用sns.boxplot或sns.catplot在盒图中添加哈茨
提问于 2022-06-17 09:02:57
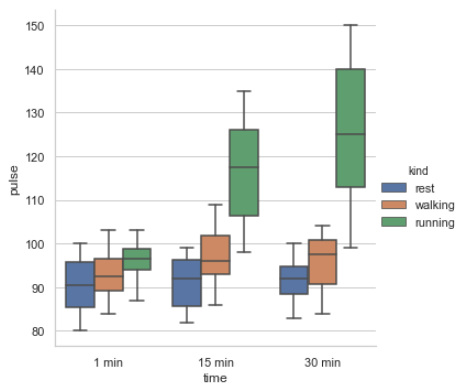
我需要把舱口加到一个明确的盒子里。我所拥有的是:
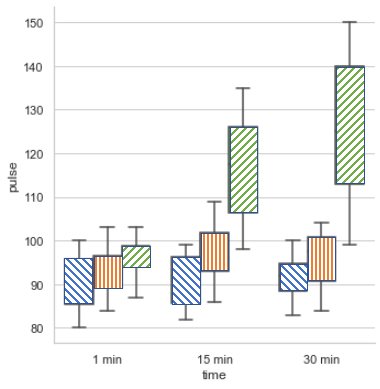
我需要的是这样的东西(用中线):
我试过的是这个代码:
exercise = sns.load_dataset("exercise")
g = sns.catplot(x="time", y="pulse", hue="kind", data=exercise, kind="box")
bars = g.axes[0][0].patches
hatches=['//','..','xx','//','..','xx','//','..','xx']
for pat,bar in zip(hatches,bars):
bar.set_hatch(pat)这只会产生第一个数字。第3-6行的想法来自于this question。但是,在第3行中获得axes[0][0]的想法来自于this question。
因为FacetGrids没有像补丁或容器这样的属性,所以很难将个别图中关于孵化的答案调整到分类图中,所以我无法理解它。
其他复习过的不起作用的问题:
回答 1
Stack Overflow用户
回答已采纳
发布于 2022-06-17 14:35:55
for ax in g.axes.flat:.
ax.patches对每个子图/ FacetGrid进行迭代,
- 包含
matplotlib.patches.Rectangle和matplotlib.patches.PathPatch,因此正确的matplotlib.patches.Rectangle和matplotlib.patches.PathPatch必须为每个组在每个方面出现所有颜色,否则patches和hatches将不匹配。在这种情况下,可能需要手动或条件代码来正确确定works.
,因此zip(patches, h)
- Tested in
python 3.10**,**pandas 1.4.2**,**matplotlib 3.5.1**,**seaborn 0.11.2
import matplotlib as mpl
import seaborn as sns
# load test data
exercise = sns.load_dataset("exercise")
# plot
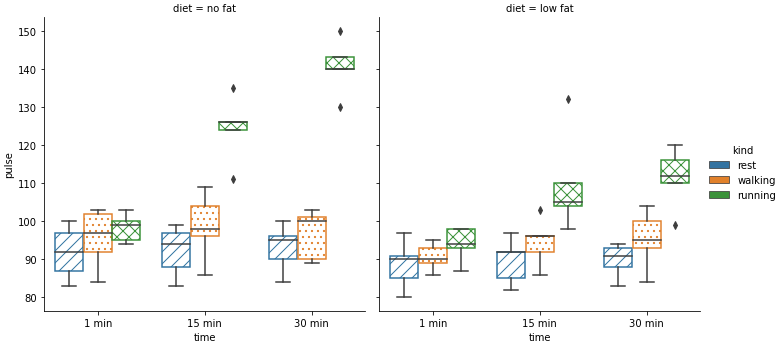
g = sns.catplot(x="time", y="pulse", hue="kind", data=exercise, col='diet', kind="box")
# hatches must equal the number of hues (3 in this case)
hatches = ['//', '..', 'xx']
# iterate through each subplot / Facet
for ax in g.axes.flat:
# select the correct patches
patches = [patch for patch in ax.patches if type(patch) == mpl.patches.PathPatch]
# the number of patches should be evenly divisible by the number of hatches
h = hatches * (len(patches) // len(hatches))
# iterate through the patches for each subplot
for patch, hatch in zip(patches, h):
patch.set_hatch(hatch)
fc = patch.get_facecolor()
patch.set_edgecolor(fc)
patch.set_facecolor('none')
- 添加以下内容,以更改图例.
for lp, hatch in zip(g.legend.get_patches(), hatches):
    lp.set_hatch(hatch)
    fc = lp.get_facecolor()
    lp.set_edgecolor(fc)
    lp.set_facecolor('none')

- 如果仅使用轴级
sns.boxplot,则不需要迭代多个轴.
。
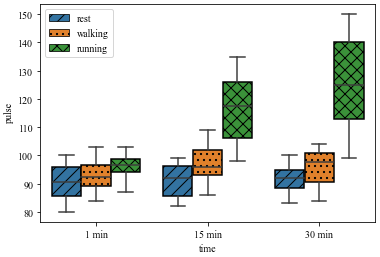
ax = sns.boxplot(x="time", y="pulse", hue="kind", data=exercise)

# select the correct patches
patches = [patch for patch in ax.patches if type(patch) == mpl.patches.PathPatch]
# the number of patches should be evenly divisible by the number of hatches
h = hatches * (len(patches) // len(hatches))
# iterate through the patches for each subplot
for patch, hatch in zip(patches, h):
    patch.set_hatch(hatch)
    fc = patch.get_facecolor()
    patch.set_edgecolor(fc)
    patch.set_facecolor('none')

l = ax.legend()

for lp, hatch in zip(l.get_patches(), hatches):
    lp.set_hatch(hatch)
    fc = lp.get_facecolor()
    lp.set_edgecolor(fc)
    lp.set_facecolor('none')
保留方框情节的面部颜色的patch.set_facecolor('none')
- Set
- :
- 将edgecolor移除为
'k'(黑色)而不是fc、patch.set_edgecolor('k').
- Applies to the `sns.catplot` code too.ax = sns.boxplot(x="time", y="pulse", hue="kind", data=exercise)
# select the correct patches
patches = [patch for patch in ax.patches if type(patch) == mpl.patches.PathPatch]
# the number of patches should be evenly divisible by the number of hatches
h = hatches * (len(patches) // len(hatches))
# iterate through the patches for each subplot
for patch, hatch in zip(patches, h):
patch.set_hatch(hatch)
patch.set_edgecolor('k')
l = ax.legend()
for lp, hatch in zip(l.get_patches(), hatches):
lp.set_hatch(hatch)
lp.set_edgecolor('k')
页面原文内容由Stack Overflow提供。腾讯云小微IT领域专用引擎提供翻译支持
原文链接:
https://stackoverflow.com/questions/72656861
复制相关文章
相似问题
腾讯云开发者

Copyright © 2013 - 2026 Tencent Cloud. All Rights Reserved. 腾讯云 版权所有
深圳市腾讯计算机系统有限公司 ICP备案/许可证号:粤B2-20090059 ![]() 粤公网安备44030502008569号
粤公网安备44030502008569号
腾讯云计算(北京)有限责任公司 京ICP证150476号 | 京ICP备11018762号