
以与数据无关的方式在R中添加文本注释
以与数据无关的方式在R中添加文本注释
提问于 2022-06-13 16:09:35
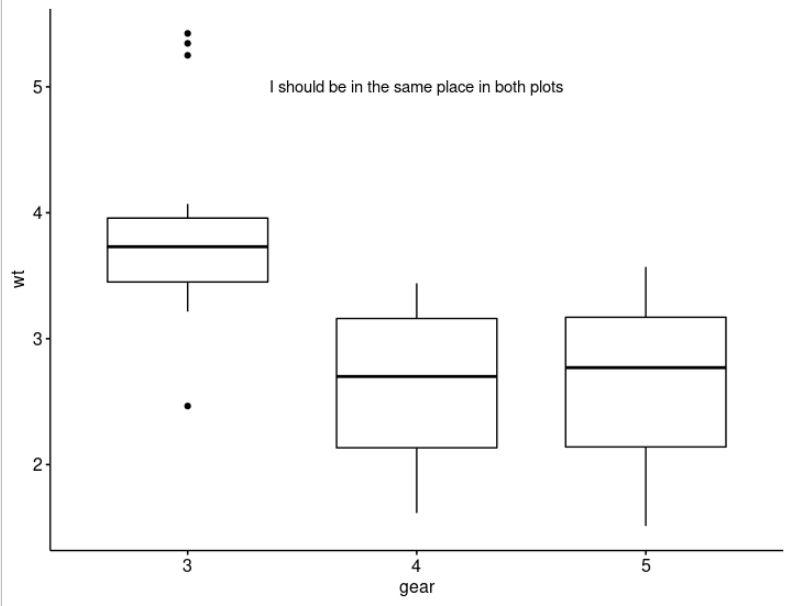
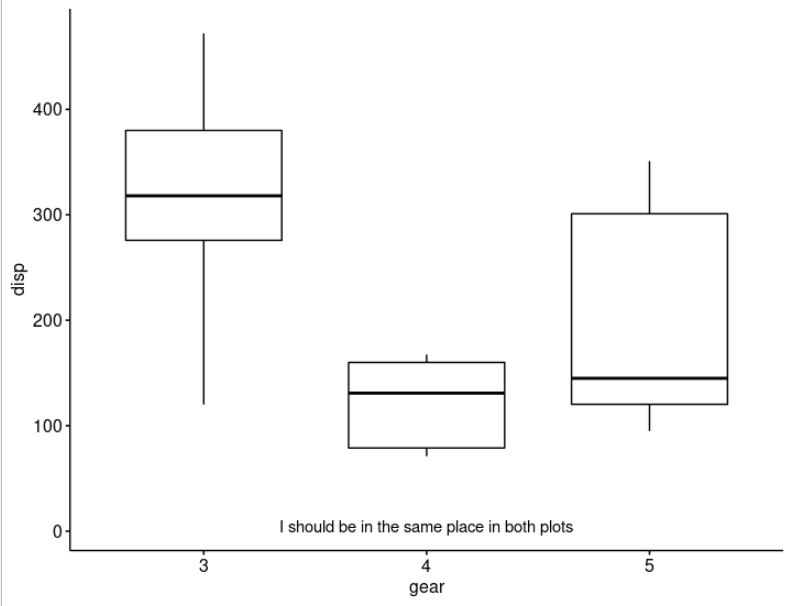
我试图迭代地注释许多情节。我希望在所有图上都有一个注释,但它们都有不同的y轴标度。如何在不使用y-值的情况下注释一个图?必须有一个独立于数据的方法,但我想我缺少一个关键的词汇,所以我的搜索是徒劳的。
通常情况下,我会将annotate("text", x = 5, y = 10)添加到ggplot对象中,但这是行不通的,因为y的范围在不同的组之间有很大的差异。
请记住,大约有30个地块可供跟踪,下面是一个使用mtcar和ggpubr的玩具示例。
library(ggpubr)
ggboxplot(mtcars, x = "gear", y = "wt") +
  annotate("text", x = 2, y = 5, label = "I should be in the same place in both plots")
ggboxplot(mtcars, x = "gear", y = "disp") +
  annotate("text", x = 2, y = 5, label = "I should be in the same place in both plots")
回答 3
Stack Overflow用户
发布于 2022-06-13 16:16:16
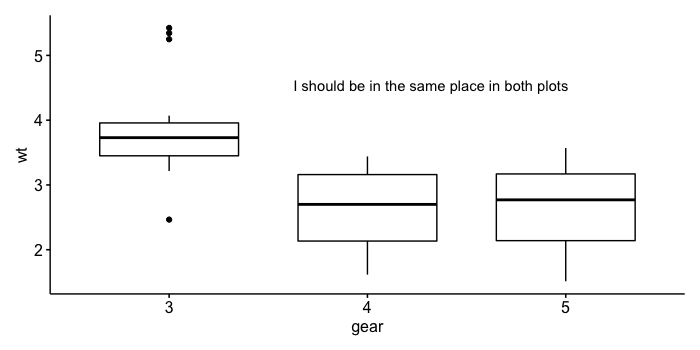
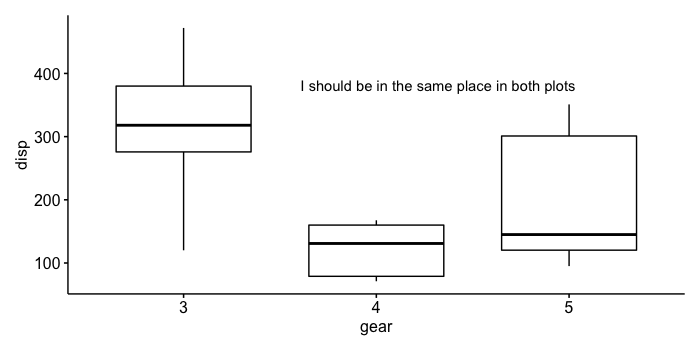
您可以使用来自patchwork的patchwork来覆盖一个仅由标签组成的地块,该标记位于对方的地块上。
library(ggpubr)
library(patchwork)

label <- ggplot() +
  annotate("text", x = 2, y = 5, label = "I should be in the same place in both plots") +
  coord_cartesian(clip = "off") +   # allows text to overflow if needed
  theme_void()
ggboxplot(mtcars, x = "gear", y = "wt") +
  inset_element(label, left = 0.4, bottom = 0.7, right = 0.8, top = 0.8)
ggboxplot(mtcars, x = "gear", y = "disp") +
  inset_element(label, left = 0.4, bottom = 0.7, right = 0.8, top = 0.8)
我们可以更进一步界定:
label_layer <- inset_element(label, left = 0.4, bottom = 0.7,
                             right = 0.8, top = 0.8)
那么每一个情节都可以是:
ggboxplot(mtcars, x = "gear", y = "wt") + label_layerStack Overflow用户
发布于 2022-06-13 16:21:24
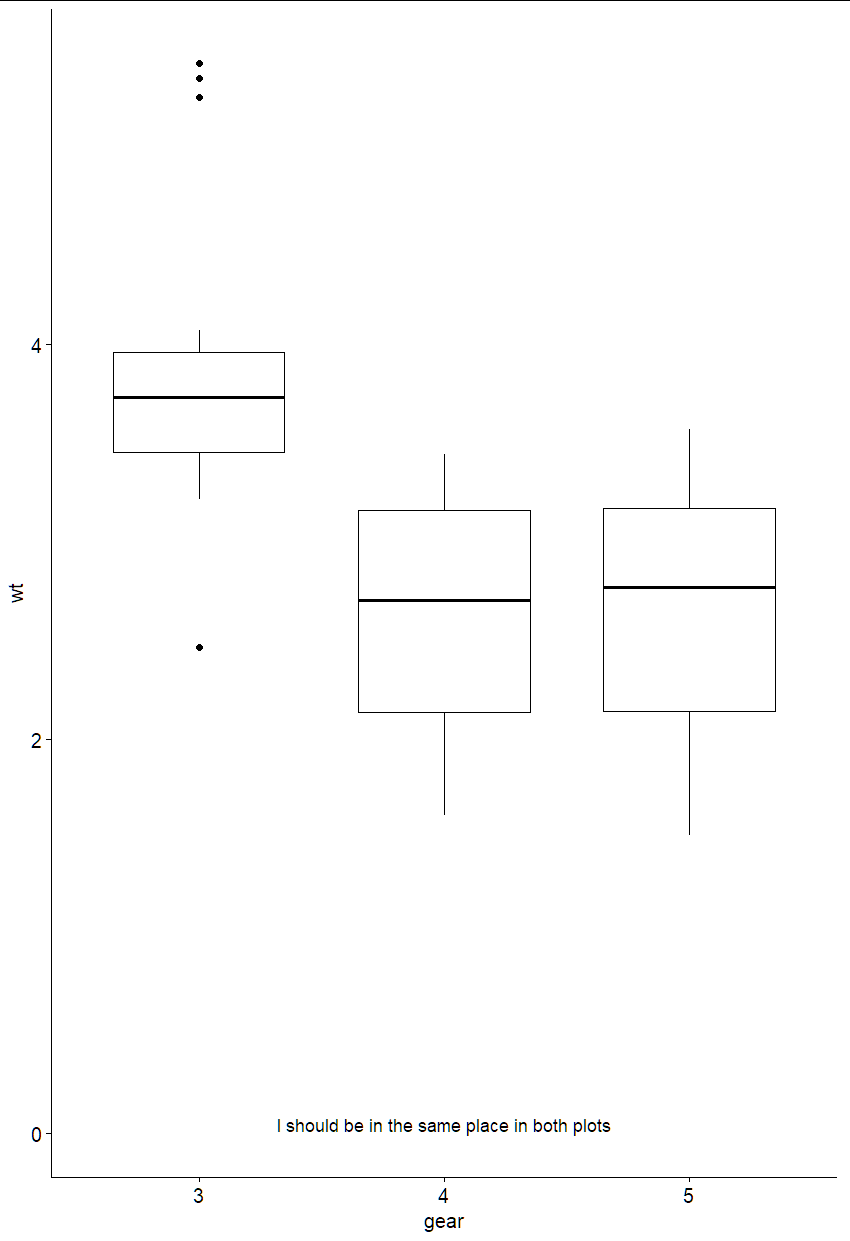
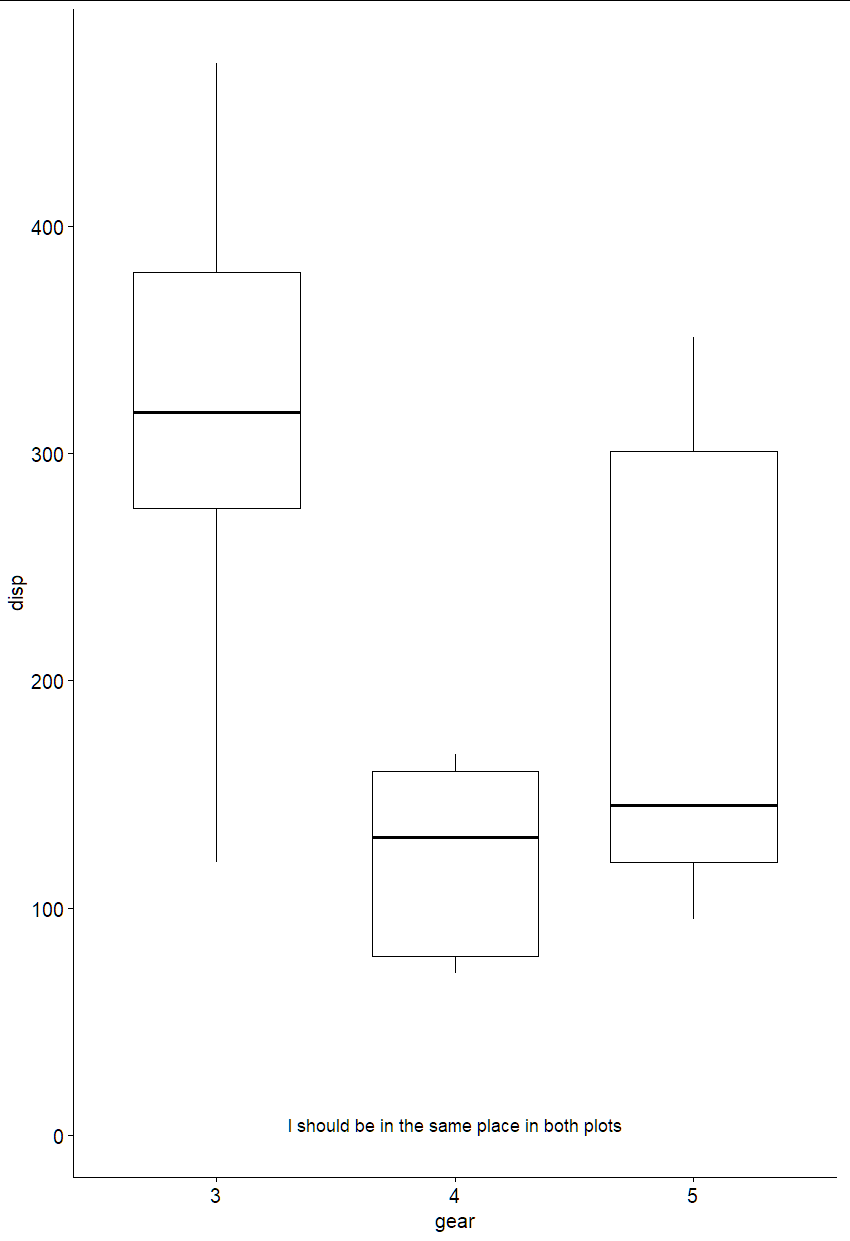
将第一个y划分为100:
library(ggpubr)
ggboxplot(mtcars, x = "gear", y = "wt") +
  annotate("text", x = 2, y = 5/100, label = "I should be in the same place in both plots")
ggboxplot(mtcars, x = "gear", y = "disp") +
  annotate("text", x = 2, y = 5, label = "I should be in the same place in both plots")
Stack Overflow用户
发布于 2022-06-13 16:19:42
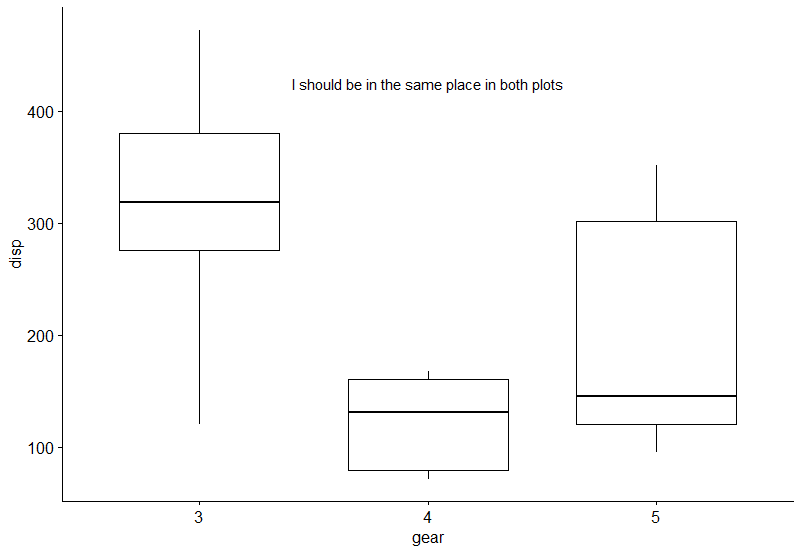
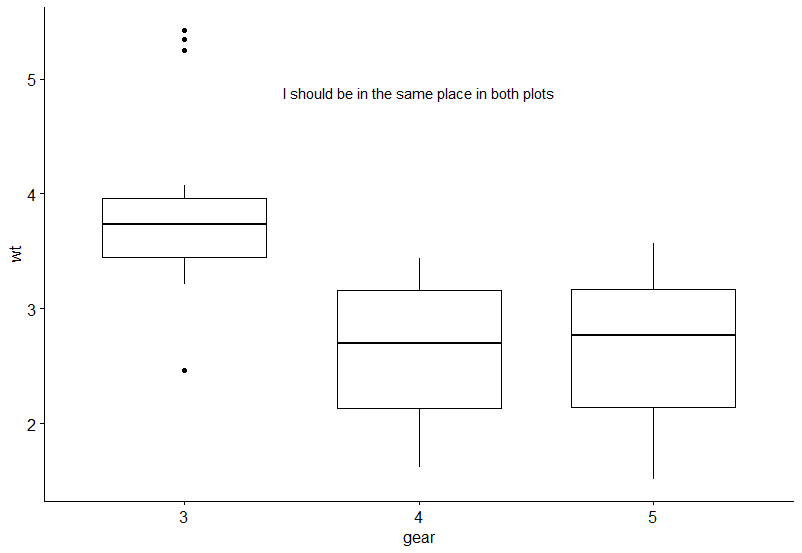
您可以传递轴最大值的百分比。这并不能让他们总是站在同一个位置,但离他们很近。
library(ggpubr)
ggboxplot(mtcars, x = "gear", y = "wt") +
  annotate("text", y = max(mtcars$wt)*.9, x = 2, label = "I should be in the same place in both plots")
ggboxplot(mtcars, x = "gear", y = "disp") +
  annotate("text", y = max(mtcars$disp)*.9, x = 2, label = "I should be in the same place in both plots")
页面原文内容由Stack Overflow提供。腾讯云小微IT领域专用引擎提供翻译支持
原文链接:
https://stackoverflow.com/questions/72605888
复制相关文章
相似问题
腾讯云开发者

Copyright © 2013 - 2026 Tencent Cloud. All Rights Reserved. 腾讯云 版权所有
深圳市腾讯计算机系统有限公司 ICP备案/许可证号:粤B2-20090059  粤公网安备44030502008569号
腾讯云计算(北京)有限责任公司 京ICP证150476号 | 京ICP备11018762号