
Matplotlib -自定义网格分层
Matplotlib -自定义网格分层
提问于 2022-06-11 09:10:05
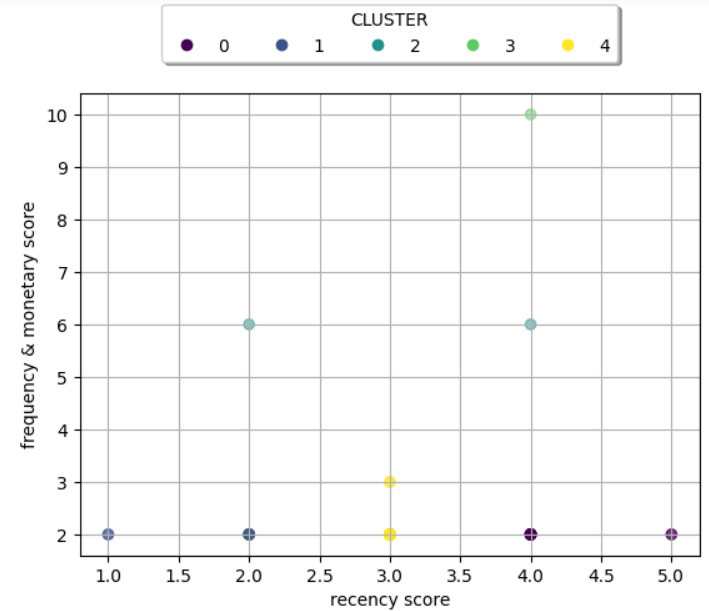
我有以下要求显示散点图:
这是我的代码:
# Define Data

x = result.iloc[:,6] #R Score
y = result.iloc[:,11] #FM Score

# Create Figure

fig, ax = plt.subplots()
ax.set_ylabel('frequency & monetary score')
ax.set_xlabel('recency score')
ax.scatter(x, y,c=z, cmap='viridis', alpha=0.5)
ax.legend(*sc.legend_elements(), title="CLUSTER",loc='lower center',
          bbox_to_anchor=(0.5, 1.05),ncol=5, fancybox=True, shadow=True)
ax.grid(True)
plt.show()
产出:
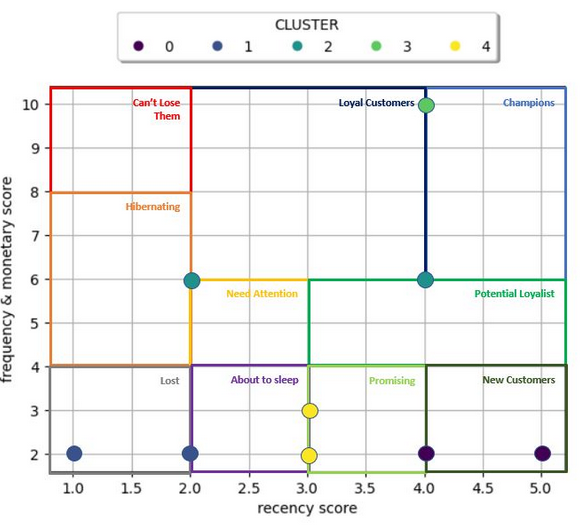
问题是,我不知道如何在特定的网格位置上创建自定义的分层(例如x轴的冠军杯层:4-5和y-轴:6-10)。
这可以使用matplotlib吗?
谢谢
回答 1
Stack Overflow用户
回答已采纳
发布于 2022-06-11 15:45:51
对于那些跌跌撞撞的问题,我找到了解决方案,使用图像网格。
# Define Data

x = result.iloc[:,6] #R Score
y = result.iloc[:,11]/2 #FM Score

extent = (0,5, 0, 5)
# Create Figure

fig, ax = plt.subplots()
ax.set_ylabel('frequency & monetary score')
ax.set_xlabel('recency score')
ax.scatter(x, y,c=z, cmap='viridis', alpha=0.5,zorder=2)
ax.legend(*sc.legend_elements(), title="CLUSTER",loc='lower center',
          bbox_to_anchor=(0.5, 1.05),ncol=5, fancybox=True, shadow=True)
ax.grid(True)
layer_img=plt.imread("assets/rfm.JPG")
plt.imshow(layer_img,zorder=1, extent=extent)
plt.show()
结果:

页面原文内容由Stack Overflow提供。腾讯云小微IT领域专用引擎提供翻译支持
原文链接:
https://stackoverflow.com/questions/72583068
复制相关文章
相似问题
腾讯云开发者

Copyright © 2013 - 2026 Tencent Cloud. All Rights Reserved. 腾讯云 版权所有
深圳市腾讯计算机系统有限公司 ICP备案/许可证号:粤B2-20090059 ![]() 粤公网安备44030502008569号
粤公网安备44030502008569号
腾讯云计算(北京)有限责任公司 京ICP证150476号 | 京ICP备11018762号