
用facet_nested绘制线图存在的问题
用facet_nested绘制线图存在的问题
提问于 2022-06-10 13:08:03
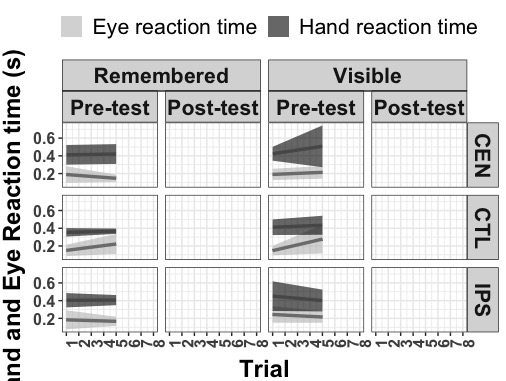
我试图用面嵌套来绘制线条图(我经常用条形图来绘制)。由于一些奇怪的原因,情节的一部分丢失了。我一直在代码周围工作,试图将“组”添加到美学中,但它似乎不起作用。下面是我最后得到的图表
我试图用面嵌套来绘制线条图(我经常用条形图来绘制)。由于一些奇怪的原因,情节的一部分丢失了。我一直在代码周围工作,试图将“组”添加到美学中,但它似乎不起作用。下面是我最后得到的图表
data10 <- structure(list(Group = c("Visible", "Visible", "Visible", "Visible",
"Visible", "Visible", "Visible", "Visible", "Visible", "Visible",
"Visible", "Visible", "Remembered", "Remembered", "Remembered",
"Remembered", "Remembered", "Remembered", "Remembered", "Remembered",
"Remembered", "Remembered", "Remembered", "Remembered", "Visible",
"Visible", "Visible", "Visible", "Visible", "Visible", "Visible",
"Visible", "Visible", "Visible", "Visible", "Visible", "Remembered",
"Remembered", "Remembered", "Remembered", "Remembered", "Remembered",
"Remembered", "Remembered", "Remembered", "Remembered", "Remembered",
"Remembered"), Condition = c("CEN", "CEN", "CEN", "CEN", "IPS",
"IPS", "IPS", "IPS", "CTL", "CTL", "CTL", "CTL", "CEN", "CEN",
"CEN", "CEN", "IPS", "IPS", "IPS", "IPS", "CTL", "CTL", "CTL",
"CTL", "CEN", "CEN", "CEN", "CEN", "IPS", "IPS", "IPS", "IPS",
"CTL", "CTL", "CTL", "CTL", "CEN", "CEN", "CEN", "CEN", "IPS",
"IPS", "IPS", "IPS", "CTL", "CTL", "CTL", "CTL"), test1 = c("Pre-test",
"Pre-test", "Post-test", "Post-test", "Pre-test", "Pre-test",
"Post-test", "Post-test", "Pre-test", "Pre-test", "Post-test",
"Post-test", "Pre-test", "Pre-test", "Post-test", "Post-test",
"Pre-test", "Pre-test", "Post-test", "Post-test", "Pre-test",
"Pre-test", "Post-test", "Post-test", "Pre-test", "Pre-test",
"Post-test", "Post-test", "Pre-test", "Pre-test", "Post-test",
"Post-test", "Pre-test", "Pre-test", "Post-test", "Post-test",
"Pre-test", "Pre-test", "Post-test", "Post-test", "Pre-test",
"Pre-test", "Post-test", "Post-test", "Pre-test", "Pre-test",
"Post-test", "Post-test"), test = structure(c(1L, 1L, 2L, 2L,
1L, 1L, 2L, 2L, 1L, 1L, 2L, 2L, 1L, 1L, 2L, 2L, 1L, 1L, 2L, 2L,
1L, 1L, 2L, 2L, 1L, 1L, 2L, 2L, 1L, 1L, 2L, 2L, 1L, 1L, 2L, 2L,
1L, 1L, 2L, 2L, 1L, 1L, 2L, 2L, 1L, 1L, 2L, 2L), .Label = c("Pre-test",
"Post-test"), class = "factor"), trial2 = c(1, 5, 9, 13, 1, 5,
9, 13, 1, 5, 9, 13, 1, 5, 9, 13, 1, 5, 9, 13, 1, 5, 9, 13, 1,
5, 9, 13, 1, 5, 9, 13, 1, 5, 9, 13, 1, 5, 9, 13, 1, 5, 9, 13,
1, 5, 9, 13), trial = c("Pre-1", "Pre-5", "Post-1", "Post-5",
"Pre-1", "Pre-5", "Post-1", "Post-5", "Pre-1", "Pre-5", "Post-1",
"Post-5", "Pre-1", "Pre-5", "Post-1", "Post-5", "Pre-1", "Pre-5",
"Post-1", "Post-5", "Pre-1", "Pre-5", "Post-1", "Post-5", "Pre-1",
"Pre-5", "Post-1", "Post-5", "Pre-1", "Pre-5", "Post-1", "Post-5",
"Pre-1", "Pre-5", "Post-1", "Post-5", "Pre-1", "Pre-5", "Post-1",
"Post-5", "Pre-1", "Pre-5", "Post-1", "Post-5", "Pre-1", "Pre-5",
"Post-1", "Post-5"), N = c(12, 10, 12, 11, 11, 9, 12, 12, 12,
10, 12, 12, 9, 11, 12, 12, 8, 12, 11, 12, 9, 9, 12, 12, NA, NA,
NA, NA, NA, NA, NA, NA, NA, NA, NA, NA, NA, NA, NA, NA, NA, NA,
NA, NA, NA, NA, NA, NA), Variables = c("Eye reaction time", "Eye reaction time",
"Eye reaction time", "Eye reaction time", "Eye reaction time",
"Eye reaction time", "Eye reaction time", "Eye reaction time",
"Eye reaction time", "Eye reaction time", "Eye reaction time",
"Eye reaction time", "Eye reaction time", "Eye reaction time",
"Eye reaction time", "Eye reaction time", "Eye reaction time",
"Eye reaction time", "Eye reaction time", "Eye reaction time",
"Eye reaction time", "Eye reaction time", "Eye reaction time",
"Eye reaction time", "Hand reaction time", "Hand reaction time",
"Hand reaction time", "Hand reaction time", "Hand reaction time",
"Hand reaction time", "Hand reaction time", "Hand reaction time",
"Hand reaction time", "Hand reaction time", "Hand reaction time",
"Hand reaction time", "Hand reaction time", "Hand reaction time",
"Hand reaction time", "Hand reaction time", "Hand reaction time",
"Hand reaction time", "Hand reaction time", "Hand reaction time",
"Hand reaction time", "Hand reaction time", "Hand reaction time",
"Hand reaction time"), Eye_Rx = c(0.190333333, 0.213909091, 0.164583333,
0.2375, 0.24375, 0.215444444, 0.168916667, 0.259916667, 0.147333333,
0.277363636, 0.20425, 0.240833333, 0.189222222, 0.146727273,
0.111083333, 0.13225, 0.183375, 0.166583333, 0.115727273, 0.14,
0.15, 0.222222222, 0.206916667, 0.133083333, 0.423583333, 0.507636364,
0.374083333, 0.399166667, 0.45075, 0.401333333, 0.411583333,
0.459083333, 0.411166667, 0.433727273, 0.380333333, 0.4115, 0.411555556,
0.420636364, 0.294416667, 0.29875, 0.40425, 0.405833333, 0.330818182,
0.318, 0.353666667, 0.366555556, 0.338666667, 0.319333333), sd = c(0.113040084,
0.120666859, 0.093087894, 0.149627112, 0.164622502, 0.099557912,
0.058356987, 0.323980207, 0.094897393, 0.27273697, 0.199661589,
0.16341238, 0.143796538, 0.069264841, 0.03580873, 0.041850654,
0.155523023, 0.091204524, 0.065353027, 0.077994172, 0.098432718,
0.173048965, 0.179821861, 0.063938121, 0.138244486, 0.398595854,
0.107139211, 0.19240149, 0.296251467, 0.188482095, 0.183202054,
0.232274703, 0.155725769, 0.181612274, 0.135318032, 0.165268652,
0.169866941, 0.189299906, 0.071530614, 0.049045665, 0.117074762,
0.100927367, 0.090403339, 0.060077223, 0.073431941, 0.045735957,
0.208057393, 0.068832251), se = c(0.032631861, 0.036382427, 0.02687216,
0.043193627, 0.047522423, 0.033185971, 0.016846211, 0.09352503,
0.027394518, 0.08223329, 0.057637336, 0.047173091, 0.047932179,
0.020884135, 0.01033709, 0.012081243, 0.054985692, 0.026328478,
0.019704679, 0.022514978, 0.032810906, 0.057682988, 0.0519101,
0.018457346, 0.039907746, 0.120181172, 0.030928426, 0.055541526,
0.085520432, 0.062827365, 0.052885877, 0.067051931, 0.044954157,
0.054758161, 0.039062951, 0.04770895, 0.056622314, 0.057076069,
0.02064911, 0.014158264, 0.041392179, 0.029135221, 0.027257632,
0.0173428, 0.024477314, 0.015245319, 0.060060996, 0.019870159
), ci = c(0.071822243, 0.081065099, 0.059145226, 0.095068532,
0.104596148, 0.076526985, 0.03707826, 0.205847203, 0.060294927,
0.183227189, 0.126858921, 0.103827273, 0.110531804, 0.046532753,
0.022751782, 0.026590637, 0.130020501, 0.05794859, 0.043904761,
0.049555133, 0.075662085, 0.13301721, 0.114253359, 0.040624344,
0.087836356, 0.267780338, 0.068073007, 0.122246075, 0.188229202,
0.144880163, 0.116401031, 0.147580306, 0.098943433, 0.122008786,
0.085976975, 0.105006692, 0.13057129, 0.127173408, 0.045448384,
0.031162129, 0.097876951, 0.064126189, 0.060733789, 0.038171246,
0.056444787, 0.035155769, 0.132193361, 0.043733926)), row.names = c(NA,
-48L), spec = structure(list(cols = list(Group = structure(list(), class = c("collector_character",
"collector")), Condition = structure(list(), class = c("collector_character",
"collector")), test1 = structure(list(), class = c("collector_character",
"collector")), test = structure(list(), class = c("collector_double",
"collector")), trial2 = structure(list(), class = c("collector_double",
"collector")), trial = structure(list(), class = c("collector_character",
"collector")), N = structure(list(), class = c("collector_double",
"collector")), Variables = structure(list(), class = c("collector_character",
"collector")), Eye_Rx = structure(list(), class = c("collector_double",
"collector")), sd = structure(list(), class = c("collector_double",
"collector")), se = structure(list(), class = c("collector_double",
"collector")), ci = structure(list(), class = c("collector_double",
"collector"))), default = structure(list(), class = c("collector_guess",
"collector")), delim = ","), class = "col_spec"), class = c("spec_tbl_df",
"tbl_df", "tbl", "data.frame"))library(tidyverse)
library(ggplot2)
library(ggthemes)
library(ggh4x)
p <- ggplot(data10, aes(x = trial2, y = Eye_Rx),group = test) +
geom_line(aes(color = Variables), lwd=1.2, show.legend = F) +
geom_ribbon(aes(ymin = Eye_Rx - 1.96 * se, ymax = Eye_Rx + 1.96 * se, fill = Variables), alpha = .6) +
scale_fill_manual(values = c("gray", "black"))+ scale_color_manual(values = c("black", "gray")) + facet_nested(Condition ~ Group + test)+ theme_bw() + xlab("Trial") + ylab("Hand and Eye Reaction time (s)") +
scale_x_continuous(limits = c(1,8), breaks = seq(1,8,1),labels = c("1", "2", "3", "4", "5", "6", "7", "8")) + theme(axis.text.x = element_text(size = 12,face="bold", angle = 90),#, angle = 10, hjust = .5, vjust = .5),
axis.text.y = element_text(size = 12, face = "bold"),
axis.title.y = element_text(vjust= 1.8, size = 18),
axis.title.x = element_text(vjust= -0.5, size = 18),
axis.title = element_text(face = "bold")) + theme(legend.position="top") +
guides(fill=guide_legend(title="")) + theme(legend.text=element_text(size=16),legend.title=element_text(size=14) ) +
theme(strip.text = element_text(face="bold", size=16))
p 回答 2
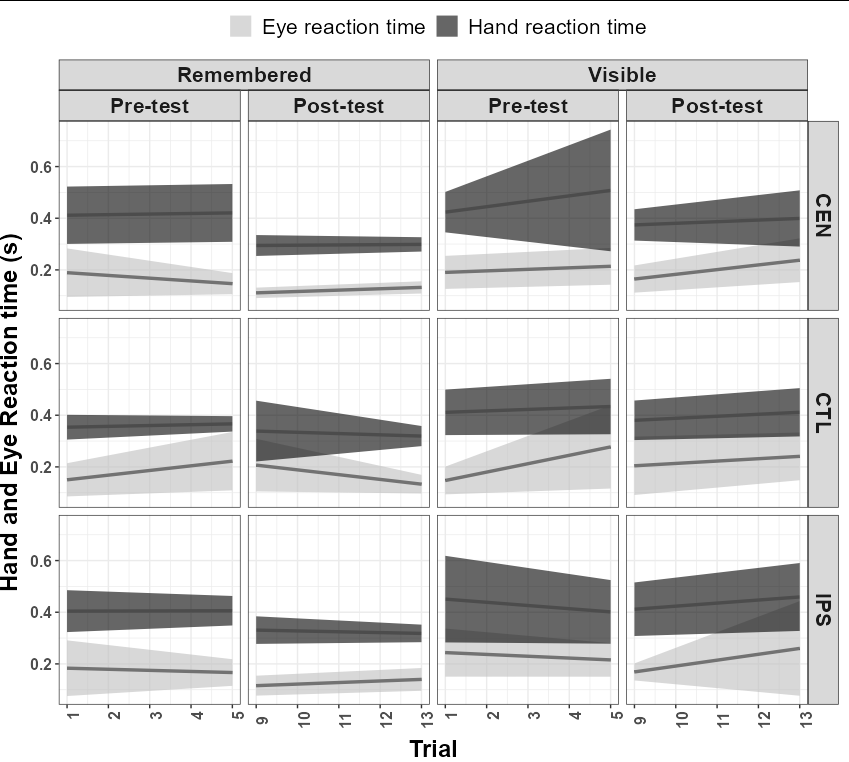
Stack Overflow用户
发布于 2022-06-10 13:26:40
您排除了所有的post-test结果,因为这些结果的x轴值都是9或更多。删除scale_x_continuous并将scales = "free_x"添加到facet_nested
ggplot(data10, aes(x = trial2, y = Eye_Rx),group = test) +
  geom_line(aes(color = Variables), lwd = 1.2, show.legend = FALSE) +
  geom_ribbon(aes(ymin = Eye_Rx - 1.96 * se, ymax = Eye_Rx + 1.96 * se,
                 fill = Variables), alpha = 0.6) +
  scale_fill_manual(values = c("gray", "black"), name = NULL) +
  scale_color_manual(values = c("black", "gray")) +
  xlab("Trial") +
  ylab("Hand and Eye Reaction time (s)") +
  facet_nested(Condition ~ Group + test, scales = "free_x") +
  theme_bw() +
  theme(axis.text.x = element_text(size = 12,face="bold", angle = 90),
       axis.text.y = element_text(size = 12, face = "bold"),
       axis.title.y = element_text(vjust= 1.8, size = 18),
       axis.title.x = element_text(vjust= -0.5, size = 18),
       axis.title = element_text(face = "bold"),
       legend.position = "top",
       legend.text = element_text(size = 16),
       legend.title = element_text(size = 14),
       strip.text = element_text(face = "bold", size = 16))
Stack Overflow用户
发布于 2022-06-10 13:28:47
问题是x轴的极限。
修改扩展限制的结果如下:
ggplot(data10, aes(x = trial2, y = Eye_Rx),group = test) +
  geom_line(aes(color = Variables), lwd=1.2, show.legend = F) +
  geom_ribbon(aes(ymin = Eye_Rx - 1.96 * se, ymax = Eye_Rx + 1.96 * se, fill = Variables), alpha = .6) +
  scale_fill_manual(values = c("gray", "black"))+
  scale_color_manual(values = c("black", "gray")) +
  facet_nested(Condition ~ Group + test, scales = "free")+ theme_bw() +
  xlab("Trial") + ylab("Hand and Eye Reaction time (s)") +
  scale_x_continuous(limits = c(1,13), breaks = seq(1,13,1),
                     labels = as.character(1:13)) +
  theme(axis.text.x = element_text(size = 12,face="bold", angle = 90),#, angle = 10, hjust = .5, vjust = .5),
        axis.text.y = element_text(size = 12, face = "bold"),
        axis.title.y = element_text(vjust= 1.8, size = 18),
        axis.title.x = element_text(vjust= -0.5, size = 18),
        axis.title = element_text(face = "bold")) +  theme(legend.position="top") +
  guides(fill=guide_legend(title="")) +
  theme(legend.text=element_text(size=16),legend.title=element_text(size=14) ) +
  theme(strip.text = element_text(face="bold", size=16))
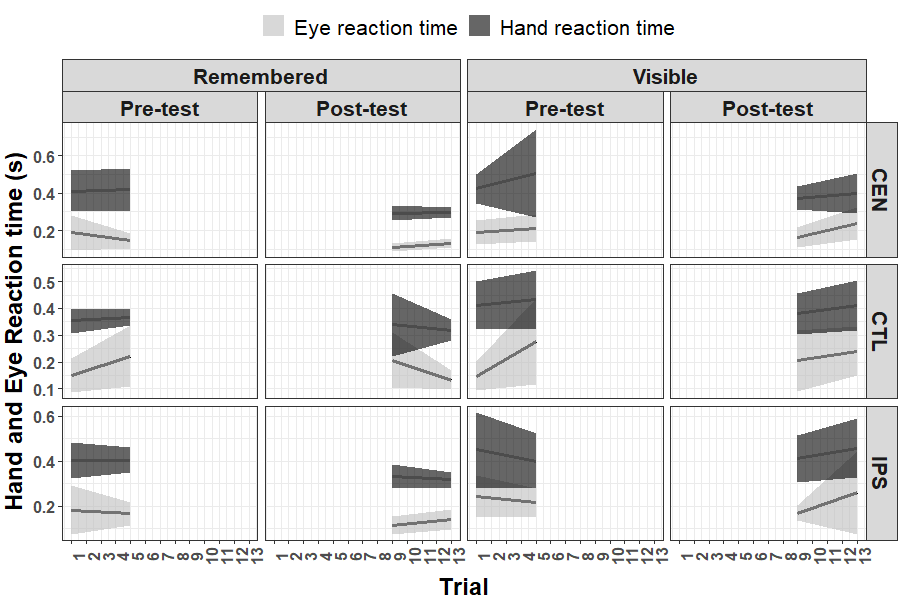
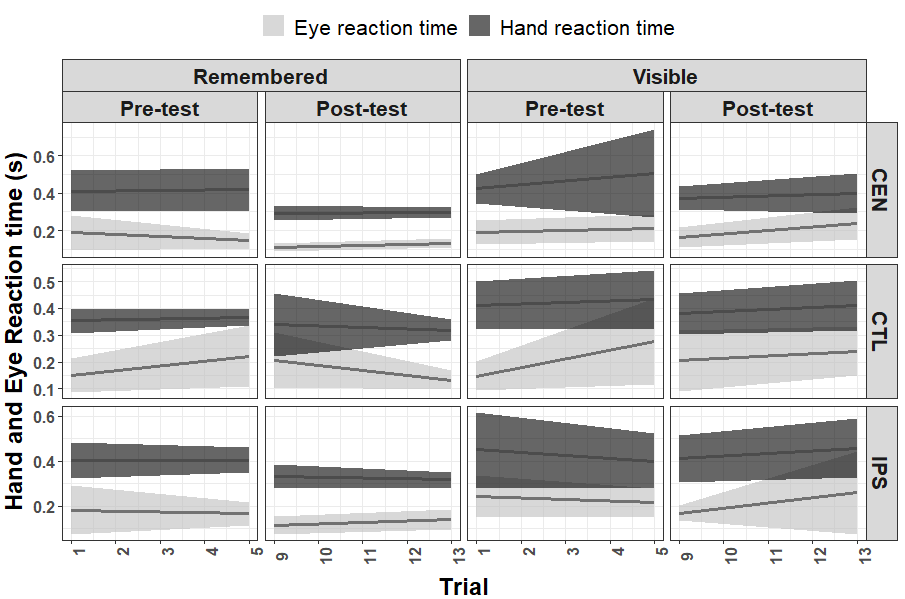
取消限制并使刻度=“免费”,给出如下内容:
ggplot(data10, aes(x = trial2, y = Eye_Rx),group = test) +
  geom_line(aes(color = Variables), lwd=1.2, show.legend = F) +
  geom_ribbon(aes(ymin = Eye_Rx - 1.96 * se, ymax = Eye_Rx + 1.96 * se, fill = Variables), alpha = .6) +
  scale_fill_manual(values = c("gray", "black"))+
  scale_color_manual(values = c("black", "gray")) +
  facet_nested(Condition ~ Group + test, scales = "free")+ theme_bw() +
  xlab("Trial") + ylab("Hand and Eye Reaction time (s)")  +
  theme(axis.text.x = element_text(size = 12,face="bold", angle = 90),#, angle = 10, hjust = .5, vjust = .5),
        axis.text.y = element_text(size = 12, face = "bold"),
        axis.title.y = element_text(vjust= 1.8, size = 18),
        axis.title.x = element_text(vjust= -0.5, size = 18),
        axis.title = element_text(face = "bold")) +  theme(legend.position="top") +
  guides(fill=guide_legend(title="")) +
  theme(legend.text=element_text(size=16),legend.title=element_text(size=14) ) +
  theme(strip.text = element_text(face="bold", size=16))
页面原文内容由Stack Overflow提供。腾讯云小微IT领域专用引擎提供翻译支持
原文链接:
https://stackoverflow.com/questions/72574806
复制相关文章
相似问题
腾讯云开发者

Copyright © 2013 - 2026 Tencent Cloud. All Rights Reserved. 腾讯云 版权所有
深圳市腾讯计算机系统有限公司 ICP备案/许可证号:粤B2-20090059 ![]() 粤公网安备44030502008569号
粤公网安备44030502008569号
腾讯云计算(北京)有限责任公司 京ICP证150476号 | 京ICP备11018762号