
元数据:森林移除或移动元估计列
元数据:森林移除或移动元估计列
提问于 2022-06-10 06:28:54
我正试图更改森林地块的格式,以便为出版做准备。
我想移动最右边的列,它显示当前的效果估计(在我的例子中是赔率比)。该列是固定在绘图的右侧,还是可以移动,以便与其他列对齐,而森林地块本身位于最右侧。
这是我当前的森林地块代码
# Forest plot of odds ratio
options(na.action = "na.pass")
forest(res.or,
       addpred=TRUE, header=TRUE,
       atransf=exp,
       order = ormri$year,
       xlim = c(-22,10),
       ilab=cbind(m1$hiv, m1$con, m1$diffci),
       ilab.xpos=c(-14, -10, -5),
       ilab.pos = 2,
       mlab = "",
       digits = 2, cex = 0.75,
       col = "blue",
       xlab = c("Odds Ratio"),
       at=log(c(0.1, .25, 1, 10, 100)))
text(c(-15.5, -11.5, -6.5), 16.5, c("LGE+/N (%)", "LGE+/N (%)", "Diff [95% CI]"), cex=0.75)
text(c(-15.5, -11.5), 17.5, c("HIV+", "HIV -"), font =2, cex = 0.75)
## add text with Q-value, dfs, p-value, and I^2 statistic
text(-22, -1, pos=4, cex=0.75, bquote(paste("RE Model (Q = ",
                                              .(formatC(res.or$QE, digits=2, format="f")), ", df = ", .(res.or$k - res.or$p),
                                              ", p = ", .(formatC(res.or$QEp, digits=2, format="f")), "; ", I^2, " = ",
                                              .(formatC(res.or$I2, digits=1, format="f")), "%)")))
这给了这个情节
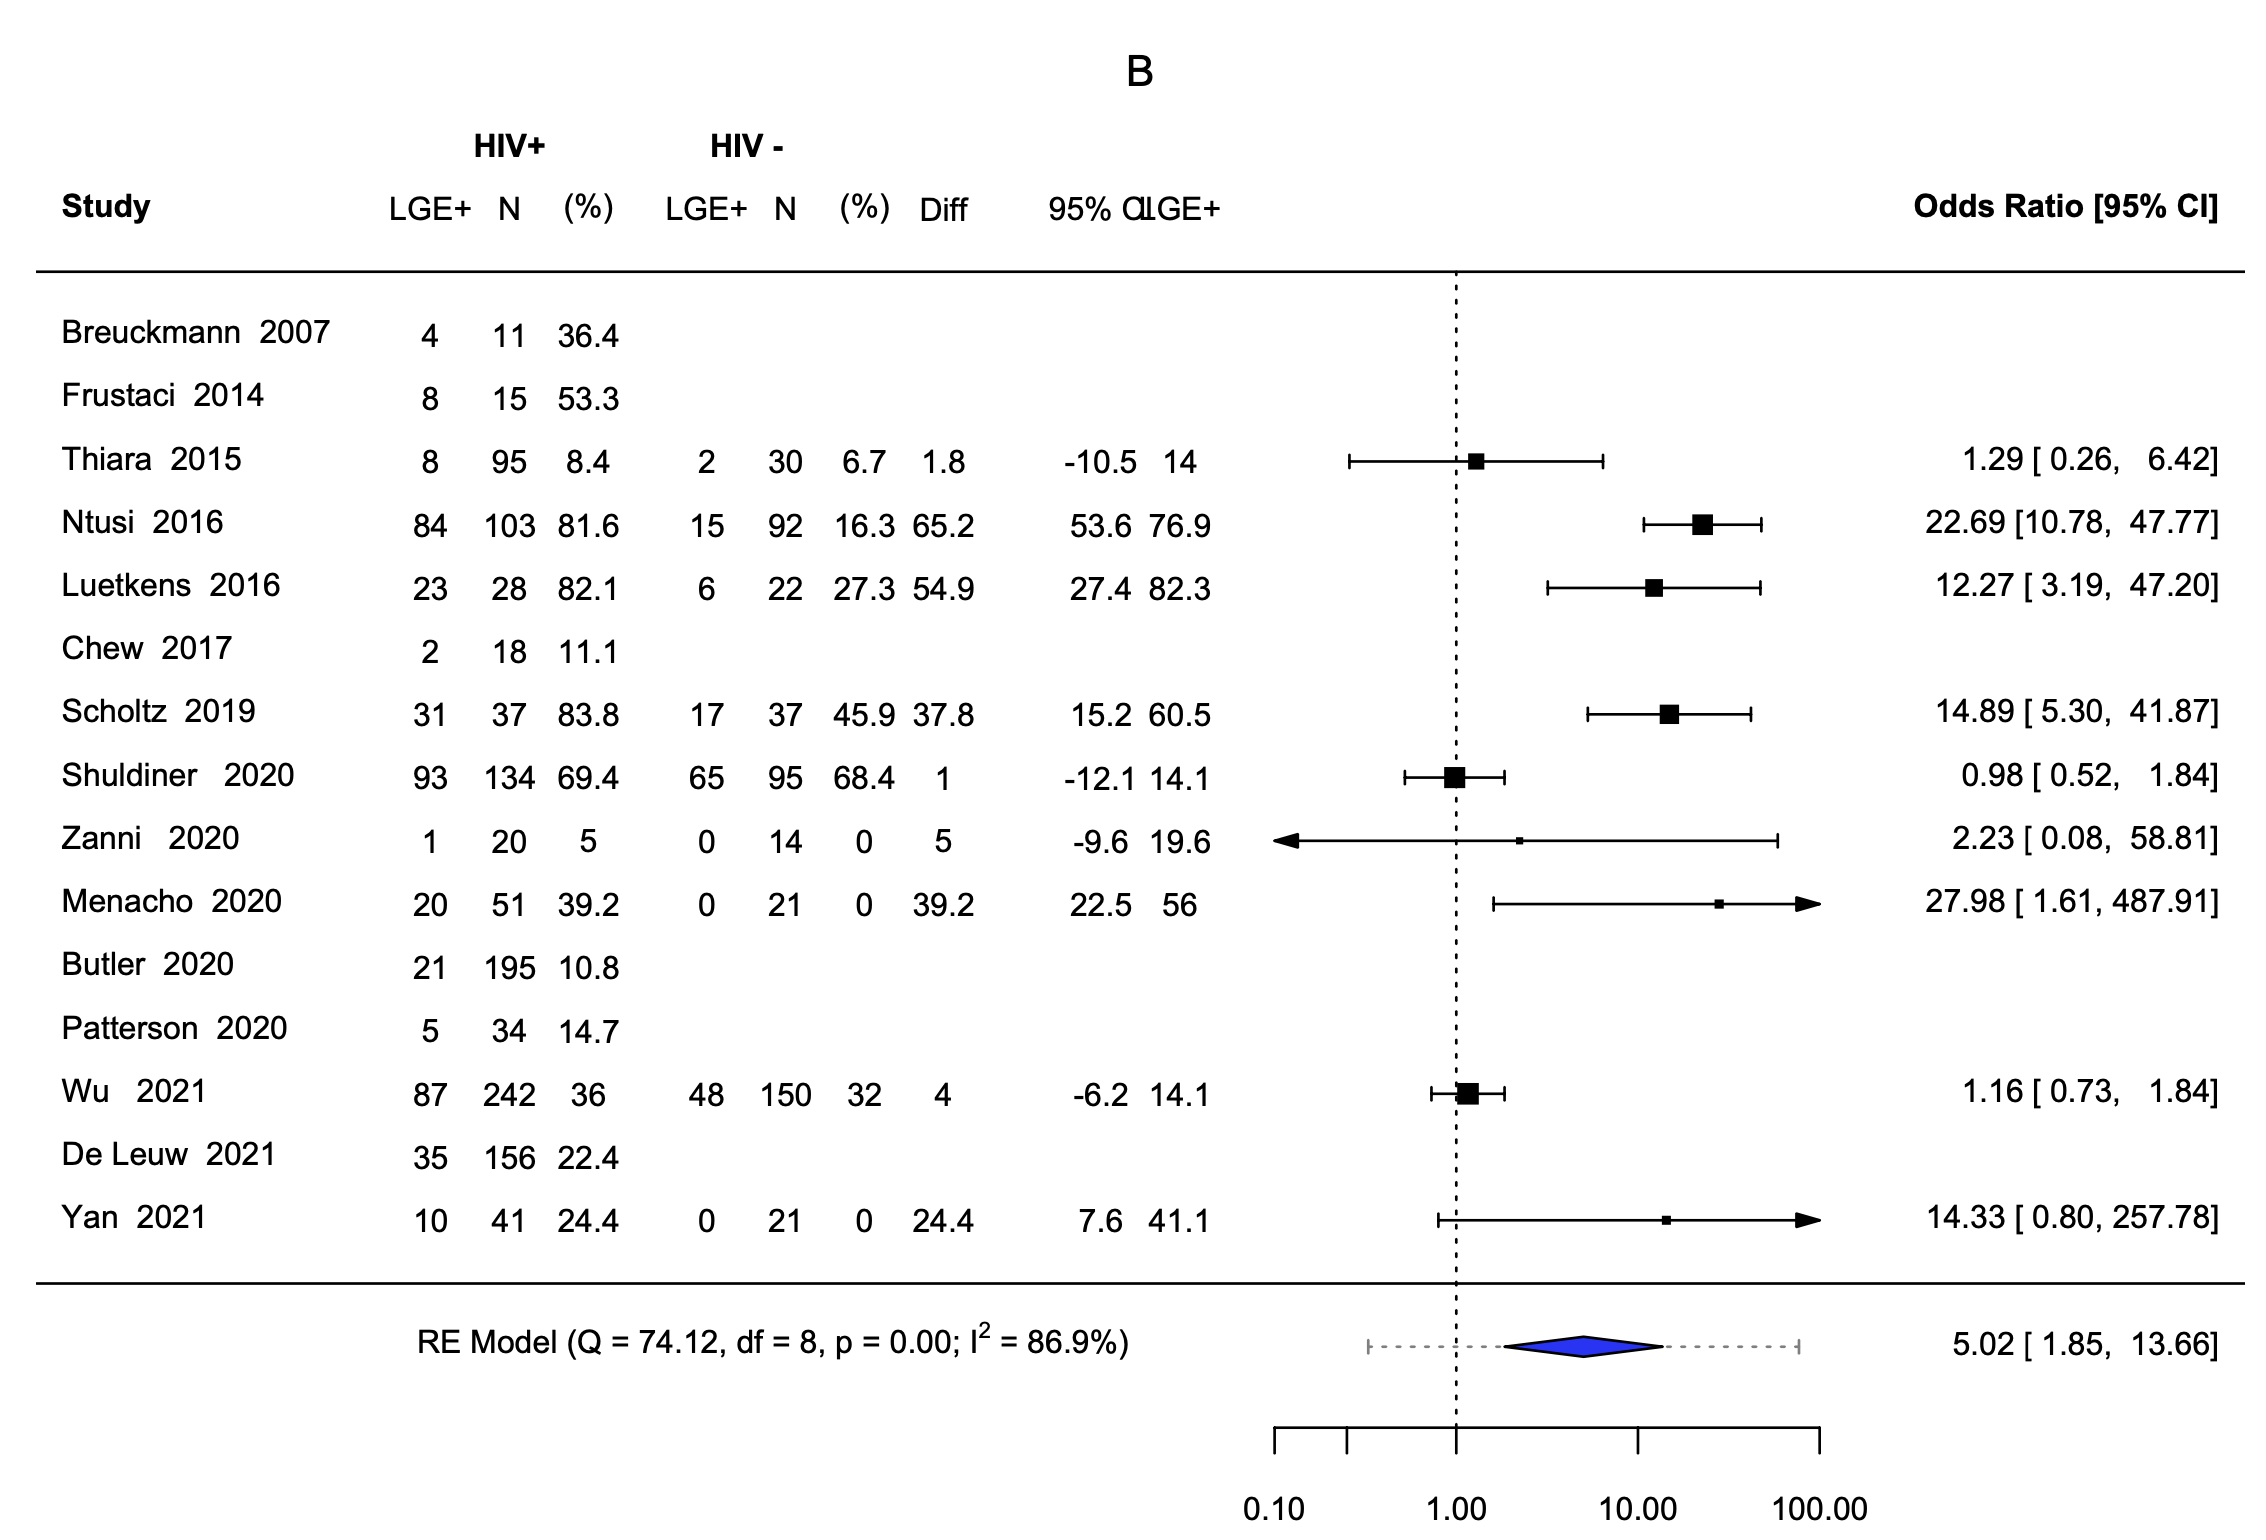
我想将比数比栏移到diff95 CI栏旁边。
回答 1
Stack Overflow用户
回答已采纳
发布于 2022-06-10 14:15:04
不久前有人要求我调整学习标签(左边)和注解(右边)的位置。为此,我添加了textpos参数。请参见:
https://wviechtb.github.io/metafor/reference/forest.rma.html#additional-arguments-1
使用这个例子,我可以说明如何使用它。用以下内容交换forest()和text()部件:
### forest plot with extra annotations
forest(res, atransf=exp, at=log(c(.05, .25, 1, 4)), xlim=c(-20,2),
       ilab=cbind(tpos, tneg, cpos, cneg), ilab.xpos=c(-14,-12,-10,-8),
       cex=.75, header="Author(s) and Year", mlab="", textpos=c(-20,-3))
op <- par(cex=.75, font=2)
text(c(-14,-12,-10,-8), 15, c("TB+", "TB-", "TB+", "TB-"))
text(c(-11,-9),     16, c("Vaccinated", "Control"))
par(op)

### add text with Q-value, dfs, p-value, and I^2 statistic
text(-20, -1, pos=4, cex=0.75, bquote(paste("RE Model (Q = ",
     .(formatC(res$QE, digits=2, format="f")), ", df = ", .(res$k - res$p),
     ", p = ", .(formatC(res$QEp, digits=2, format="f")), "; ", I^2, " = ",
.(formatC(res$I2, digits=1, format="f")), "%)")))瞧,注释在实际森林地块的左边。要为xlim、ilab.xpos和textpos找到好的值,使其看起来很好看(在绘图设备的实际维度内),这有点痛苦,但似乎您已经花了一些时间来处理这个问题,所以现在您只需要再一次完成这个过程。
页面原文内容由Stack Overflow提供。腾讯云小微IT领域专用引擎提供翻译支持
原文链接:
https://stackoverflow.com/questions/72569940
复制相关文章
相似问题
腾讯云开发者

Copyright © 2013 - 2026 Tencent Cloud. All Rights Reserved. 腾讯云 版权所有
深圳市腾讯计算机系统有限公司 ICP备案/许可证号:粤B2-20090059 ![]() 粤公网安备44030502008569号
粤公网安备44030502008569号
腾讯云计算(北京)有限责任公司 京ICP证150476号 | 京ICP备11018762号