
时间序列预测趋势线是错误的,因为索引
我正试图找出一个关于预测的问题的答案。
我正在使用tsibble,并遵循Hyndman和Athanasopoulos编写的教科书。这是一本很好的教科书,但也超出了我的体重。https://otexts.com/fpp3/
下面是我的数据的前100行作为一个小数据:
structure(list(X = 1:100, Time = structure(c(1546351200, 1546354800,
1546358400, 1546362000, 1546365600, 1546369200, 1546372800, 1546376400,
1546380000, 1546383600, 1546387200, 1546390800, 1546437600, 1546441200,
1546444800, 1546448400, 1546452000, 1546455600, 1546459200, 1546462800,
1546466400, 1546470000, 1546473600, 1546477200, 1546524000, 1546527600,
1546531200, 1546534800, 1546538400, 1546542000, 1546545600, 1546549200,
1546552800, 1546556400, 1546560000, 1546563600, 1546610400, 1546614000,
1546617600, 1546621200, 1546624800, 1546628400, 1546632000, 1546635600,
1546639200, 1546642800, 1546646400, 1546650000, 1546696800, 1546700400,
1546704000, 1546707600, 1546711200, 1546714800, 1546718400, 1546722000,
1546725600, 1546729200, 1546732800, 1546736400, 1546783200, 1546786800,
1546790400, 1546794000, 1546797600, 1546801200, 1546804800, 1546808400,
1546812000, 1546815600, 1546819200, 1546822800, 1546869600, 1546873200,
1546876800, 1546880400, 1546884000, 1546887600, 1546891200, 1546894800,
1546898400, 1546902000, 1546905600, 1546909200, 1546956000, 1546959600,
1546963200, 1546966800, 1546970400, 1546974000, 1546977600, 1546981200,
1546984800, 1546988400, 1546992000, 1546995600, 1547042400, 1547046000,
1547049600, 1547053200), tzone = "", class = c("POSIXct", "POSIXt"
)), Orders = c(390.9300738, 424.5024938, 459.9507418, 493.879574,
521.1915476, 543.6420076, 564.1188556, 583.1138192, 599.9870792,
608.2502946, 589.0774506, 552.9864864, 460.0146478, 513.6096,
565.54751, 614.3622836, 649.610842, 673.080916, 694.1457822,
714.687121, 730.0065136, 727.6420116, 704.9715348, 669.8276592,
596.9598262, 627.6943506, 663.224885, 689.6623702, 705.7821348,
705.2804398, 702.4425002, 686.257045, 673.0440842, 631.4105592,
590.2226836, 557.170647, 505.5489378, 514.1362306, 518.0591858,
519.7312244, 515.538957, 517.0255898, 516.4563428, 519.1586616,
518.8452174, 494.1823666, 468.0562396, 444.6603772, 465.6368096,
475.6484144, 481.8889642, 489.3110196, 492.9861102, 495.1878822,
496.2013992, 500.4736856, 502.9525222, 490.2884824, 465.9459928,
446.4332428, 468.827488, 475.2297188, 480.3550016, 486.8966308,
488.641556, 492.2285006, 493.485411, 501.271116, 501.7387056,
485.8849556, 462.3912654, 444.3381798, 423.7514376, 442.9296904,
456.1299334, 459.6065968, 466.132121, 468.2358706, 476.4634124,
481.580409, 484.5936224, 477.3972256, 458.546062, 439.0321916,
397.7730592, 418.1761574, 426.6949568, 435.0296632, 438.8624322,
437.5872586, 441.9915442, 445.0284556, 443.4291354, 445.9624284,
430.1143198, 420.7732792, 485.8293664, 494.2056144, 502.3287016,
509.0143842)), class = c("tbl_ts", "tbl_df", "tbl", "data.frame"
), row.names = c(NA, -100L), key = structure(list(.rows = structure(list(
    1:100), ptype = integer(0), class = c("vctrs_list_of", "vctrs_vctr",
"list"))), class = c("tbl_df", "tbl", "data.frame"), row.names = c(NA,
-1L)), index = structure("Time", ordered = TRUE), index2 = "Time", interval = structure(list(
    year = 0, quarter = 0, month = 0, week = 0, day = 0, hour = 1,
    minute = 0, second = 0, millisecond = 0, microsecond = 0,
    nanosecond = 0, unit = 0), .regular = TRUE, class = c("interval",
"vctrs_rcrd", "vctrs_vctr")))
我创建了一个图表。
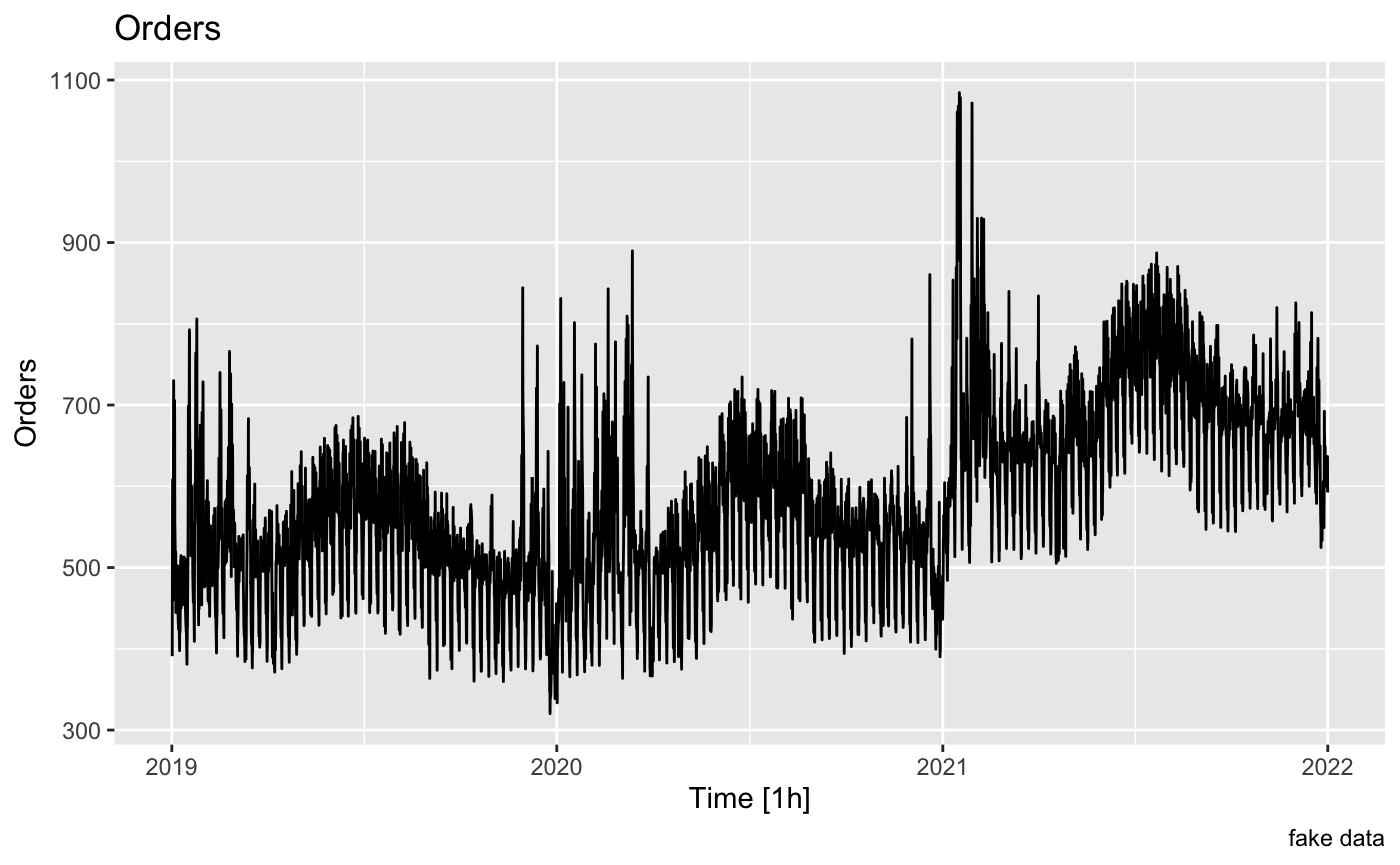
我的下一步是了解数据的趋势、季节性和周期,因此我创建了一个分解。
dcmp <- sales %>%
  model(stl = STL(Orders))
上面的代码编译,但下面的代码不工作。
dcmp <- components(dcmp)

Error in `transmute()`:
! Problem while computing `cmp = map(.fit, components)`.
Caused by error in `UseMethod()`:
! no applicable method for 'components' applied to an object of class "null_mdl"
Backtrace:
  1. generics::components(dcmp)
  8. fabletools:::map(.fit, components)
  9. base::lapply(.x, .f, ...)
 11. fabletools:::components.mdl_ts(X[[i]], ...)
 12. generics::components(object$fit, ...)
我谷歌错误信息,最终发现我应该填补缺失的空白。
因此,我填补了缺失的空白,并将NA值更改为0。
sales <- sales %>%
  fill_gaps()

sales$Orders[is.na(sales$Orders)] <- 0
然后我就可以进行分解并绘制它。
dcmp <- sales %>%
  model(stl = STL(Orders))

dcmp <- components(dcmp)

dcmp %>%
  as_tsibble() %>%
  autoplot(Orders, colour="gray") +
  geom_line(aes(y=trend), colour = "#D55E00") +
  labs(
    y = "Orders",
    title = "Orders") +
  labs(caption = "fake data")
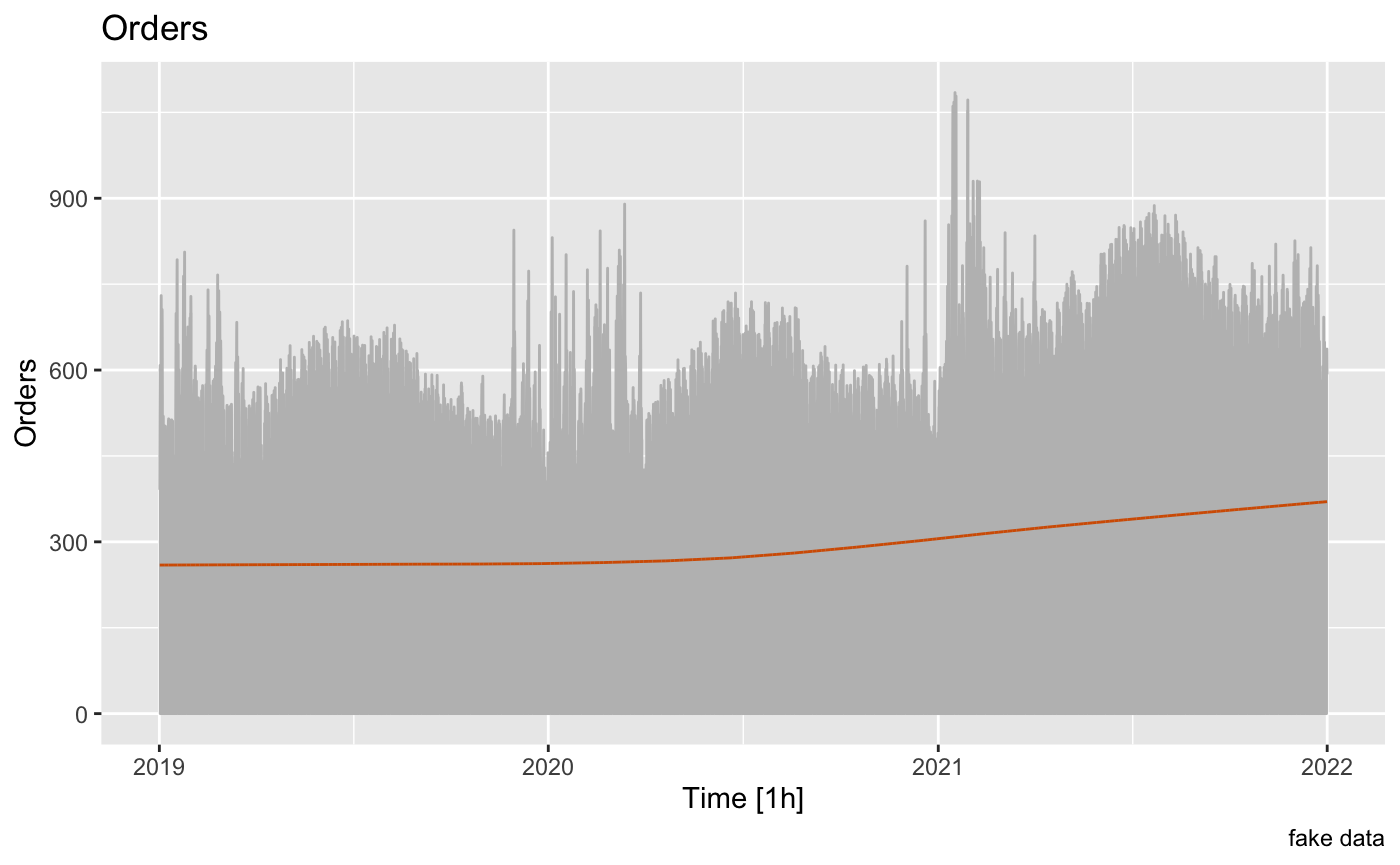
但现在我完全被困住了因为这不是我想要的。我想在销售中找到趋势,但这条橙色趋势线确实低估了它,因为它与所有的零都是平均的。
一个擅长时间序列预测的人如何获取从上午9点到晚上8点的时间和间隔中的零值的数据,并将其转化为时间序列数据,您可以在其中使用这些时间序列分解组件。我不只是想用移动平均线来近似STL在做什么,因为我想要STL图片。
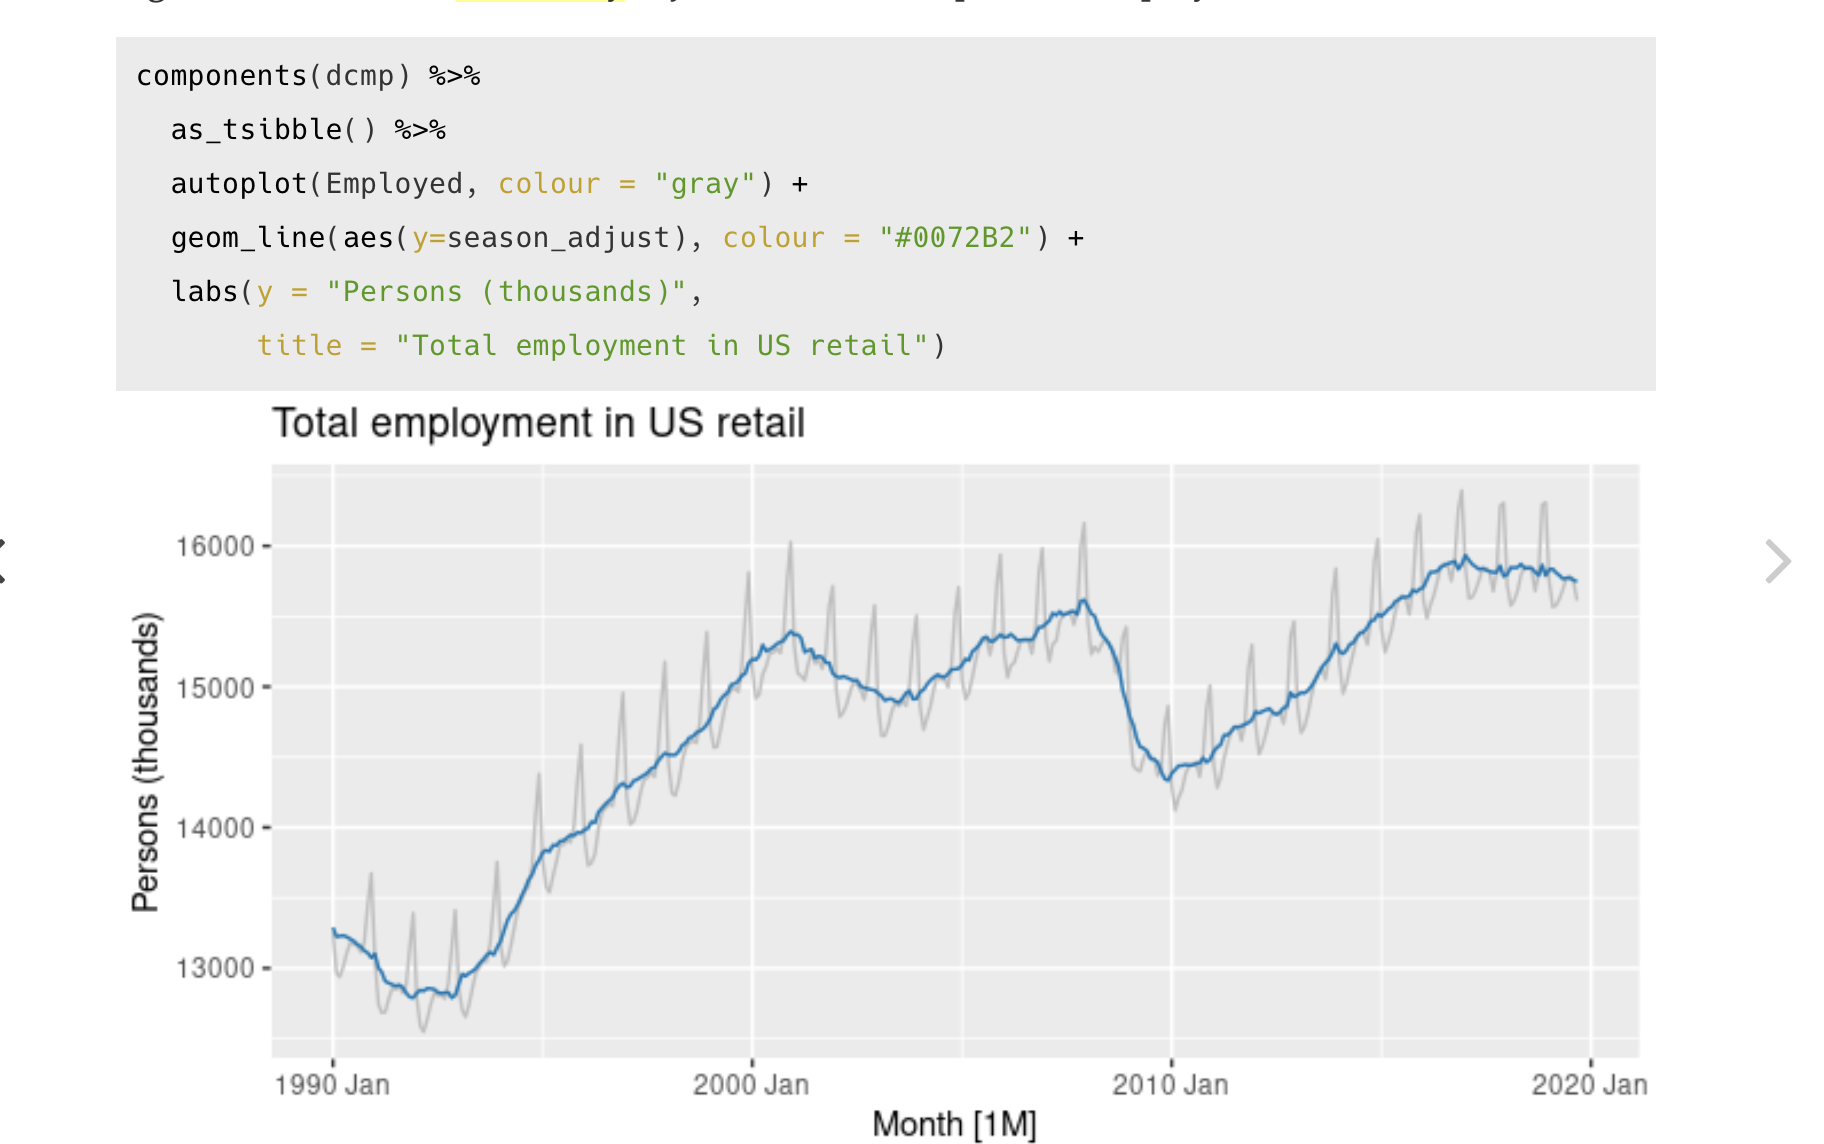
这是一张来自教科书的截图,它更接近我所期望的输出。你看,这条线更接近真实数据,而不是用零向下拉。
我希望用这组软件包在R中对时间序列进行预测,因为我也想使用这本教科书中的一些东西。
回答 1
Stack Overflow用户
发布于 2022-06-06 17:57:44
如果缺少的数据是结构化的,tsibble就不能很好地处理丢失的数据,比如没有周末的股票数据或基于工作时间的数据。它适用于预言家,但不适用于SNAIVE或其他功能。
您可以做的是创建一个索引(或者使用一个变量作为索引)。在下面的示例中,我使用您的变量X作为索引。通常,我会通过mutate创建一个。创建索引时,请记住所需的任何分组。
预测是根据这个指数进行的。因此,forecast(model, h = 12)将预测未来的12个指数值。然后,您需要将其转换回时间列。
请参阅下面的代码,以便开始工作。
library(fpp3)

sales <- df1

# If not there use mutate to create an index, now I just use X as the index
fc <- sales %>%
  # mutate(idx = row_number()) %>%
  tsibble(index = X)


dcmp <- fc %>%
  model(stl = STL(Orders))

dcmp %>%
  components() %>%
  as_tsibble() %>%
  autoplot(Orders, colour="gray") +
  geom_line(aes(y=trend), colour = "#D55E00") +
  labs(
    y = "Orders",
    title = "Orders") +
labs(caption = "fake data")https://stackoverflow.com/questions/72521088
复制相似问题
腾讯云开发者

Copyright © 2013 - 2026 Tencent Cloud. All Rights Reserved. 腾讯云 版权所有
深圳市腾讯计算机系统有限公司 ICP备案/许可证号:粤B2-20090059 ![]() 粤公网安备44030502008569号
粤公网安备44030502008569号
腾讯云计算(北京)有限责任公司 京ICP证150476号 | 京ICP备11018762号