
geom_line,geom_ribbon和geom_point的传说
geom_line,geom_ribbon和geom_point的传说
提问于 2022-06-05 06:46:34
我已经找了两天的答案了,但还是找不到该怎么做。我发现的最接近here和here的案例。但前者在情节上没有意义,后者没有答案。不费吹灰之力,怎么给我的传奇加分呢?这是我的数据:
Year <- c(2003:2020)
TheData <- c(72.6, 72.7, 72.6, 72.5, 72.4, 72.1, 71.8, 71.7, 71.8, 72.3, 72.7,
              72.9, 73.1, 73.3, 73.8, 74.7, 75.7, 77.1)
Lower <- c(72.33316, 72.05961, 71.8218, 71.62303, 71.46657, 71.35567, 71.29362,
           71.28368, 71.32915, 71.43331, 71.59947, 71.83096, 72.13113, 72.50333,
           72.95092, 73.47728, 74.08581, 74.77989)
Upper <- c(73.46626, 73.24078, 73.05676, 72.91817, 72.82899, 72.79323, 72.81489,
           72.89794, 73.04639, 73.26418, 73.55528, 73.92363, 74.37315, 74.90775,
           75.53132, 76.24776, 77.06094, 77.97473)
Model <- c(72.89971, 72.65020, 72.43928, 72.27060, 72.14778, 72.07445, 72.05425,
           72.09081, 72.18777, 72.34874, 72.57738, 72.87730, 73.25214, 73.70554,
           74.24112, 74.86252, 75.57337, 76.37731)
MyDF <- data.frame(Year, TheData, Lower, Upper, Model)
这是我的密码:
library("ggplot2")
ggplot(MyDF, aes(x = Year, y = TheData)) +
geom_point(aes(y = TheData), size = 2.5) +
geom_line(aes(x = Year, y = Model, color = "Model", fill = "Model")) +
geom_ribbon(aes(ymin = Lower, ymax = Upper, x = Year,
fill = "Confidence Interval"), alpha = 0.15) +
scale_colour_manual(
name = "", values = c("Confidence Interval" = "transparent",
"Model" = "black")) +
scale_fill_manual(
name = "", values = c("Confidence Interval" = "grey12",
"Model" = "transparent")) +
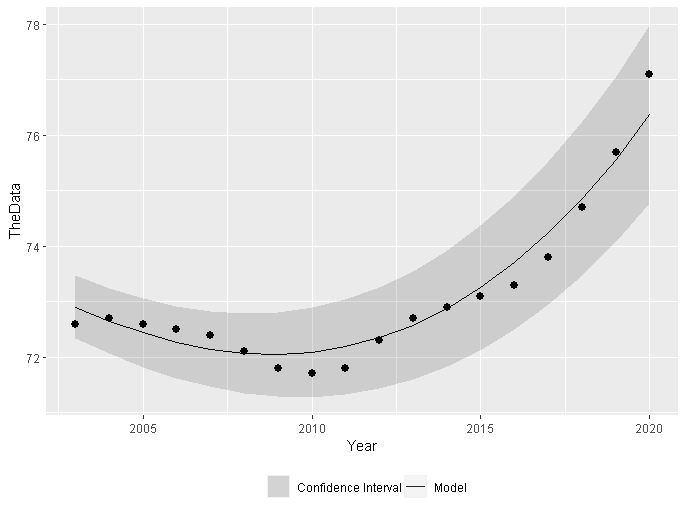
theme(legend.position = "bottom")这是我的阴谋。
回答 2
Stack Overflow用户
回答已采纳
发布于 2022-06-05 06:56:27
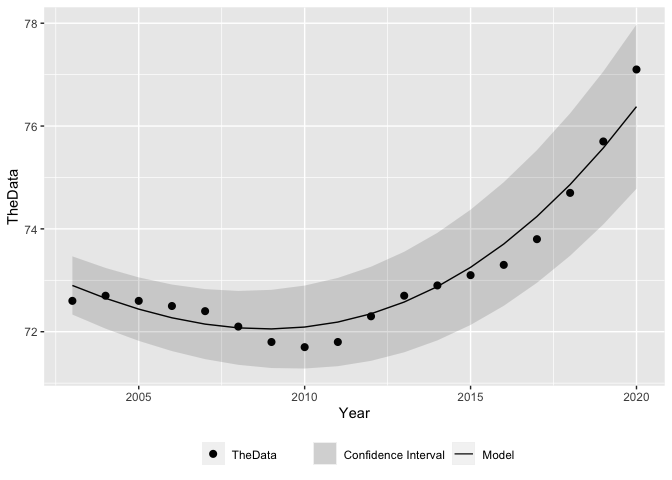
如果你想得到一个图例,你必须在美学上进行映射,例如,你可以在shape地图上为你的观点绘制一个图例:
library("ggplot2")

ggplot(MyDF, aes(x = Year, y = TheData)) +
  geom_point(aes(y = TheData, shape = "TheData"), size = 2.5) +
  geom_line(aes(x = Year, y = Model, color = "Model")) +
  geom_ribbon(aes(ymin = Lower, ymax = Upper, x = Year,
                  fill = "Confidence Interval"), alpha = 0.15) +
  scale_colour_manual(
    name = "", values = c("Confidence Interval" = "transparent",
                          "Model" = "black")) +
  scale_fill_manual(
    name = "",  values = c("Confidence Interval" = "grey12",
                           "Model" = "transparent")) +
  theme(legend.position = "bottom") +
  labs(shape = "")
Stack Overflow用户
发布于 2022-06-07 08:21:39
如果有人有兴趣将传说移到地块上腾出空间,那么显然有一种方法可以做到:
ggplot(MyDF, aes(x = Year, y = TheData)) +
geom_point(aes(y = TheData, shape = "TheData"), size = 2.5) +
geom_line(aes(x = Year, y = Model, color = "Model")) +
geom_ribbon(aes(ymin = Lower, ymax = Upper, x = Year,
fill = "Confidence Interval"), alpha = 0.15) +
scale_colour_manual(
name = "", values = c("Confidence Interval" = "transparent",
"Model" = "black")) +
scale_fill_manual(
name = "", values = c("Confidence Interval" = "grey12",
"Model" = "transparent")) +
theme(legend.position = "bottom") +
labs(shape = "") +
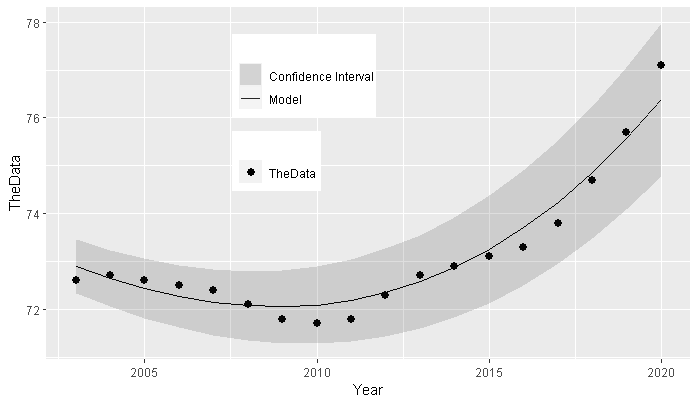
theme(legend.position = c(.4, .7))但传说似乎层出不穷:
添加+ guides(color = guide_legend(nrow = 1))不起作用:
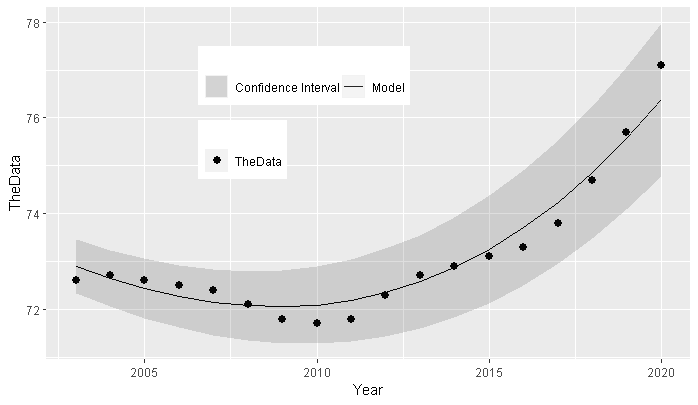
我的同事提议添加legend.box = "horizontal"。此代码适用于:
ggplot(MyDF, aes(x = Year, y = TheData)) +
geom_point(aes(y = TheData, shape = "TheData"), size = 2.5) +
geom_line(aes(x = Year, y = Model, color = "Model")) +
geom_ribbon(aes(ymin = Lower, ymax = Upper, x = Year,
                fill = "Confidence Interval"), alpha = 0.15) +
scale_colour_manual(
    name = "", values = c("Confidence Interval" = "transparent",
                          "Model" = "black")) +
scale_fill_manual(
    name = "",  values = c("Confidence Interval" = "grey12",
                           "Model" = "transparent")) +
theme(legend.position = "bottom") +
labs(shape = "") +
theme(legend.position = c(.4, .7), legend.box = "horizontal") +
guides(color = guide_legend(nrow = 1))
情节如下:
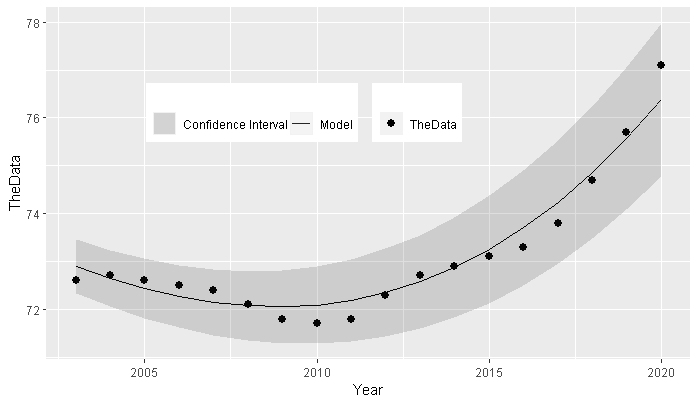
然而,我想知道为什么这个传说出现在不同的盒子里,以及如何将它组合在一起?
页面原文内容由Stack Overflow提供。腾讯云小微IT领域专用引擎提供翻译支持
原文链接:
https://stackoverflow.com/questions/72505317
复制相关文章
相似问题
腾讯云开发者

Copyright © 2013 - 2026 Tencent Cloud. All Rights Reserved. 腾讯云 版权所有
深圳市腾讯计算机系统有限公司 ICP备案/许可证号:粤B2-20090059 ![]() 粤公网安备44030502008569号
粤公网安备44030502008569号
腾讯云计算(北京)有限责任公司 京ICP证150476号 | 京ICP备11018762号