
如何在chart.js中为工具箱和轴提供不同的标签
如何在chart.js中为工具箱和轴提供不同的标签
提问于 2022-05-25 09:22:01
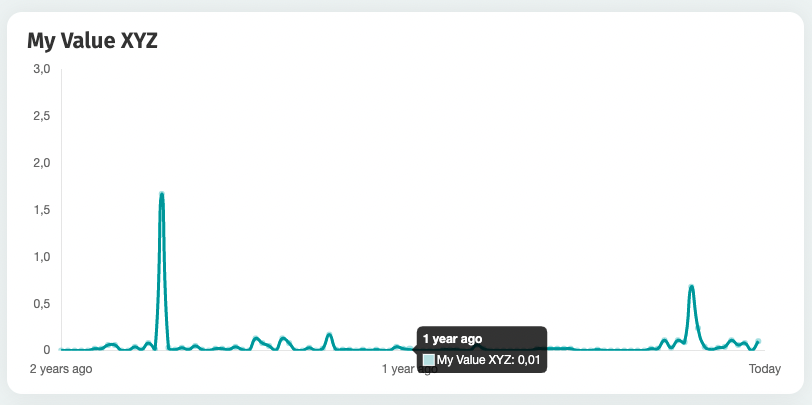
我用chart.js 3.7.0提供了一个简单的线条图。如何为轴和工具箱提供不同的标签?在我的例子中,我喜欢给空的标签,除了3个特殊的轴值,但确切的日期值,在工具箱中的一个点。
我的身材:
<script>
  chartLabels = ['2 years ago','', ... , '','1 year ago','', ... ,'','Today'];
  chartData = [0,0, ... ,0,0.13,0.08, ... ,0,0.1];
  yMax = 3;
</script>
<canvas id="chart-myvalues" width="160" height="90"></canvas>
此外,在联合来文中:
const data = {
    labels: chartLabels,
    datasets: [{
        label: 'My Value XYZ',
        data: chartData,
        tension: 0.5,
    }]
};
const config = {
    type: 'line',
    data: data,
    options: {
        plugins: {
            legend: {
                display: false
            }
        },
        scales: {
            x: {
                grid: {
                    display: false
                },
                ticks: {
                    autoSkip: false,
                    maxRotation: 0,
                    minRotation: 0
                }
            },
            y: {
                min: 0,
                max: yMax,
                grid: {
                    display: false
                }
            }
        }
    }
};
new Chart('chart-myvalue',config);正如我在这里所要求的:在上面的屏幕截图中,您可以在x轴和工具箱上看到一次1 year ago。在x轴上,就像我想要的那样。在工具箱中,我希望看到那个值xyz的确切日期(我可以提供日期,但我需要知道如何在chart.js中为工具箱和轴提供不同的标签)
回答 1
Stack Overflow用户
发布于 2022-05-26 06:43:48
它被称为tooltip,您可以阅读更多关于它的这里。基本上,您必须将callback设置为title和label,以分别更改tooltip的x轴和y轴。下面是它的样子:
boxLabels = ['2020-05-26', '2020-08-26', '2020-11-26', '2021-02-26', '2021-05-26', '2021-08-26', '2021-11-26', '2022-02-26', '2022-05-26'];

options: {
    plugins: {
        tooltip: {
            callbacks: {
                title: function(context) {
                    let title = context[0].label || boxLabels[context[0].dataIndex];
                    return title;
                 },
                 label: function(context) {
                    let label = context.dataset.label + ": " + context.dataset.data[context.datasetIndex];
                    return label;
                 }
            }
        }
    }
};请注意,context for title返回一个数组,因此必须对其进行索引才能获得元素。请参阅整个示例的片段波纹管。
chartLabels = ['2 years ago','','','','1 year ago','','','','Today'];
  chartData = [0,0,0,0,0.13,0.08,0,0,0.1];
  yMax = 3;
  boxLabels = ['2020-05-26', '2020-08-26', '2020-11-26', '2021-02-26', '2021-05-26', '2021-08-26', '2021-11-26', '2022-02-26', '2022-05-26'];

const data = {
    labels: chartLabels,
    datasets: [{
        label: 'My Value XYZ',
        data: chartData,
        tension: 0.5,
    }]
};
const config = {
    type: 'line',
    data: data,
    options: {
        plugins: {
            legend: {
                display: false
            },
            tooltip: {
                        callbacks: {
                            title: function(context) {
                                let title = context[0].label || boxLabels[context[0].dataIndex];
                        return title;
                        },
                    label: function(context) {
                                let label = context.dataset.label + ": " + context.dataset.data[context.datasetIndex];
                        return label;
                        }
                    }
                },
        },
        scales: {
            x: {
                grid: {
                    display: false
                },
                ticks: {
                    autoSkip: false,
                    maxRotation: 0,
                    minRotation: 0
                }
            },
            y: {
                min: 0,
                max: yMax,
                grid: {
                    display: false
                }
            }
        }
    }
};
new Chart('chart-myvalues',config);<html>
<head>
<meta charset="UTF-8">
<link rel="stylesheet" type="text/css" href="styles.css">
</head>
<body>
<canvas id="chart-myvalues" width="160" height="90"></canvas>
<script src="https://cdn.jsdelivr.net/npm/chart.js@3.7.1/dist/chart.min.js"></script>
</body>
</html>
页面原文内容由Stack Overflow提供。腾讯云小微IT领域专用引擎提供翻译支持
原文链接:
https://stackoverflow.com/questions/72374970
复制相关文章
相似问题
腾讯云开发者

Copyright © 2013 - 2026 Tencent Cloud. All Rights Reserved. 腾讯云 版权所有
深圳市腾讯计算机系统有限公司 ICP备案/许可证号:粤B2-20090059 ![]() 粤公网安备44030502008569号
粤公网安备44030502008569号
腾讯云计算(北京)有限责任公司 京ICP证150476号 | 京ICP备11018762号