
如何基于输入列在X轴上显示标签
如何基于输入列在X轴上显示标签
提问于 2022-05-23 02:24:38
我有以下数据框架:
library(tidyverse)
plot_dat <- structure(list(Qubit_Conc = c(45.6, 16.3, 27.7, 43, 77.7, 126,
186), unit = c("ng/uL", "ng/uL", "ng/uL", "ng/uL", "ng/uL", "ng/uL",
"ng/uL"), Fluoresence = c(4422.89, 648.5, 1648.47, 3932.18, 12444.22,
27644.98, 44428.57), node = c("0.1%FBS", "Free", "5uM", "10uM",
"20uM", "40uM", "80uM")), row.names = c(NA, -7L), class = c("tbl_df",
"tbl", "data.frame"))
看起来是这样的:
> plot_dat
# A tibble: 7 × 4
  Qubit_Conc unit  Fluoresence node
       <dbl> <chr>       <dbl> <chr>
1       45.6 ng/uL       4423. 0.1%FBS
2       16.3 ng/uL        648. Free
3       27.7 ng/uL       1648. 5uM
4       43   ng/uL       3932. 10uM
5       77.7 ng/uL      12444. 20uM
6      126   ng/uL      27645. 40uM
7 186 ng/uL 44429. 80uM 我想做的是显示基于Qubit_Conc列的x轴值。我试过了,但没有用:
ggplot(plot_dat, aes(x = Qubit_Conc, y = Fluoresence)) +
  geom_line() +
  geom_point(size = 4) +
  theme_bw() +
scale_x_continuous( labels = as.character(Qubit_Conc), breaks = Qubit_Conc) 特别是,假定确定x轴的行scale_x_continuous():
我得到的错误是:
Error in check_breaks_labels(breaks, labels) :
object 'Qubit_Conc' not found没有scale_x_continuous()的默认无花果
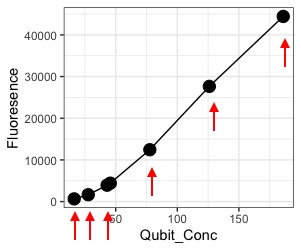
红色箭头是我们想要显示的x轴的点.因此,与50, 100, 150不同,x轴应该显示:16.3, 27.7, 43.0, 45.6, 77.7, 126.0, 186.0。
正确的方法是什么?
回答 1
Stack Overflow用户
发布于 2022-05-23 02:35:12
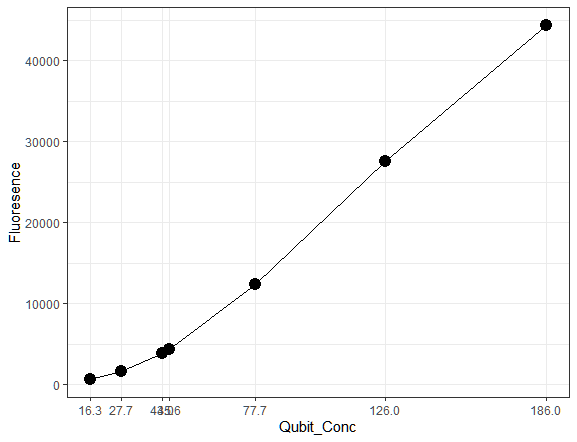
您可以将该列作为变量plot_dat$Qubit_Conc传递,因为ggplot似乎不理解列名引用
ggplot(plot_dat, aes(x = Qubit_Conc, y = Fluoresence)) +
  geom_line() +
  geom_point(size = 4) +
  theme_bw() +
  scale_x_continuous(breaks=plot_dat$Qubit_Conc,
                     minor_breaks=NULL)
我去掉了小插曲,因为它们看上去很奇怪,间隔不均匀,但是如果你想的话,你可以换回。
页面原文内容由Stack Overflow提供。腾讯云小微IT领域专用引擎提供翻译支持
原文链接:
https://stackoverflow.com/questions/72342671
复制相关文章
相似问题
腾讯云开发者

Copyright © 2013 - 2026 Tencent Cloud. All Rights Reserved. 腾讯云 版权所有
深圳市腾讯计算机系统有限公司 ICP备案/许可证号:粤B2-20090059 ![]() 粤公网安备44030502008569号
粤公网安备44030502008569号
腾讯云计算(北京)有限责任公司 京ICP证150476号 | 京ICP备11018762号