
将“传奇”标题放置在已放置在“芭蕾”格图顶部的水平传奇之上
将“传奇”标题放置在已放置在“芭蕾”格图顶部的水平传奇之上
提问于 2022-05-19 17:28:08
发行:
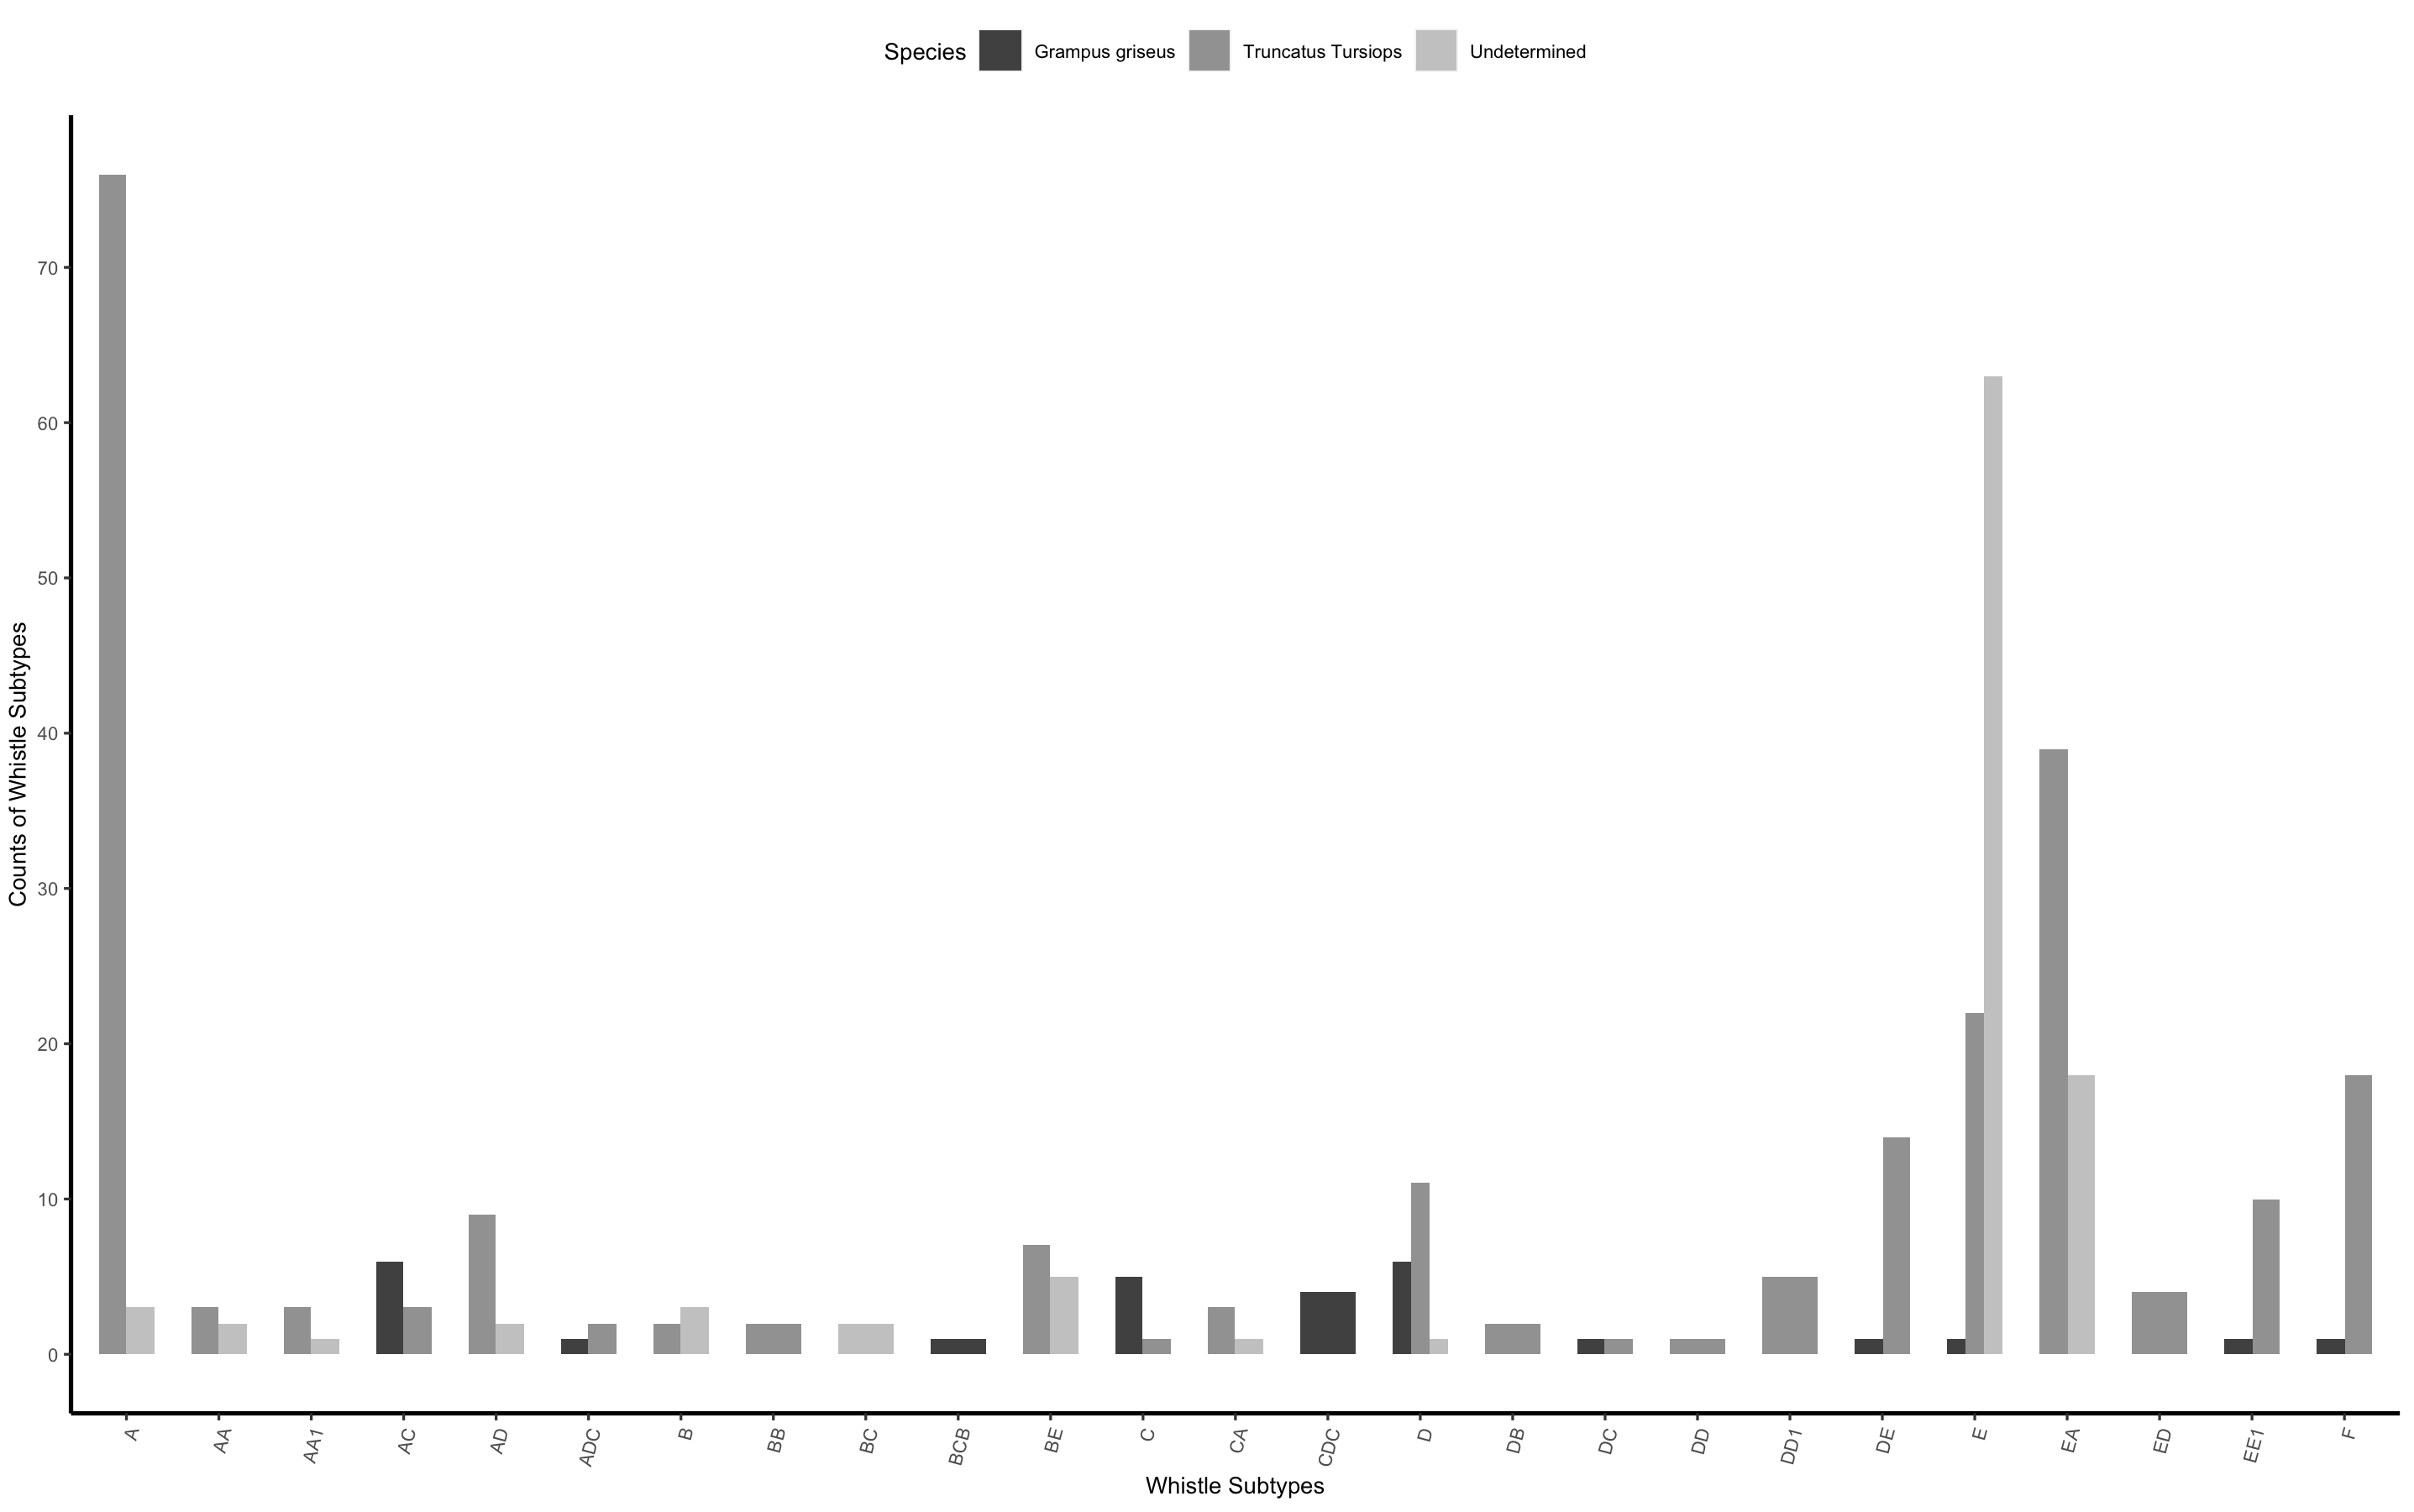
我做了很多研究,尝试了很多不同的解决方案,但我找不到解决问题的办法,至少没有一个对我有用的答案。我试图将传说标题“物种”放在水平放置的图例之上(见下文),并以其为中心。
例如,:
一般来说,我相信并正在使用正确的ggplot()命令,并且我尝试遵循其他StackOverflow问题中的示例。无论我使用什么代码,都不会发生任何事情,标题仍然保留在水平图例的左边。
有人能伸出援手吗?
在此之前,非常感谢您。
R-代码
#Open Graphics Window
dev.new()

#Barplot
Whistle_Plot<-ggplot(Whistle_Subtype, aes(x = Whistle_Type_Sub, y = N, fill = Species)) +
                            geom_bar(stat="identity", position=position_dodge(), width = 0.6) +
                            scale_fill_grey(start = 0.25, end = 0.75) +
                            theme(axis.text.x = element_text(angle = 75, hjust = 1), text = element_text(size=9)) +
                            theme(panel.background = element_blank(),
                            panel.grid.major = element_blank(),
                            panel.grid.minor = element_blank(),
                            panel.border = element_blank()) +
                            theme(axis.line.x = element_line(color="black", size = 0.8),
                            axis.line.y = element_line(color="black", size = 0.8)) +
                            labs(size = 0.8, x = "Whistle Subtypes", y = "Counts of Whistle Subtypes") +
                            theme(legend.position = 'top',
                                  legend.direction = "horizontal") +
                                  guides(color = guide_legend(title.position = "top",
                                   # hjust = 0.5 centres the title horizontally
                                   title.hjust = 0.5,
                                   label.position = "bottom"))
                            #Set the limits of the y-axis scale
                            Whistle_Plot + scale_y_continuous(breaks=seq(0, 80, by=10))
Barplot
回答 1
Stack Overflow用户
回答已采纳
发布于 2022-05-19 17:42:21
如果您切换到guides(fill = ...),您应该能够做到这一点。
尝试:
guides(fill = guide_legend(title.position = "top", title.hjust=0.5)(感谢@teunbrand,稍作更正)
页面原文内容由Stack Overflow提供。腾讯云小微IT领域专用引擎提供翻译支持
原文链接:
https://stackoverflow.com/questions/72308782
复制相关文章
相似问题
腾讯云开发者

Copyright © 2013 - 2026 Tencent Cloud. All Rights Reserved. 腾讯云 版权所有
深圳市腾讯计算机系统有限公司 ICP备案/许可证号:粤B2-20090059 ![]() 粤公网安备44030502008569号
粤公网安备44030502008569号
腾讯云计算(北京)有限责任公司 京ICP证150476号 | 京ICP备11018762号