
把灯光调高
我有以下Python代码:
import numpy as np
from matplotlib import pyplot as plt
plt.rcParams['figure.figsize'] = [12, 7]

n = 100
m = 100

X = np.arange(-n/2,n/2,1)
Y = np.arange(-m/2,m/2,1)
X, Y = np.meshgrid(X, Y)

landscape = np.exp(-0.01 * (X*X + Y*Y) )

fig, ax = plt.subplots(subplot_kw={"projection": "3d"})
ax.plot_surface(X, Y, landscape,
                linewidth=0,
                antialiased=False
                )
在笔记本中运行此操作将生成此图像。
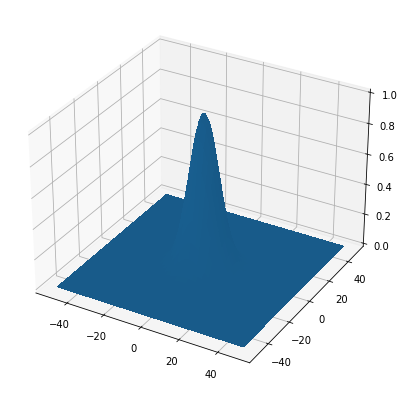
如果你仔细观察,你会发现高斯峰的左边比右边稍微轻一些。这种照明效果几乎是不可见的,不过,我想增加它,这样的三维形状变得容易可见。
我知道matplotlib.colors.LightSource,但无论我做什么,我都无法得到我想要的效果。理想情况下,我只想增加“默认”照明的强度,而不是摆弄这个。但是,如果有人能解释如何使用LightSource来处理这个图像,这也会有所帮助。
请注意,我不想应用到图像的高度地图,我也不想在上面画网格线-我只是想增加照明效果,同时保持表面的均匀颜色。
还值得一提的是,我有点被MatPlotLib困住了,因为我使用木星石与没有安装Python的学生共享笔记本,所以我需要一个解决方案来解决这个问题。
回答 2
Stack Overflow用户
发布于 2022-05-19 10:10:11
使用LightSource,您可以执行以下操作
import numpy as np
from matplotlib import pyplot as plt
from matplotlib.colors import LightSource

plt.rcParams['figure.figsize'] = [12, 7]

n = 100
m = 100

X = np.arange(-n / 2, n / 2, 1)
Y = np.arange(-m / 2, m / 2, 1)
X, Y = np.meshgrid(X, Y)

landscape = np.exp(-0.01 * (X * X + Y * Y))

fig, ax = plt.subplots(subplot_kw={"projection": "3d"})

# this is used to set the graph color to blue
blue = np.array([0., 0., 1.])
rgb = np.tile(blue, (landscape.shape[0], landscape.shape[1], 1))

ls = LightSource()
illuminated_surface = ls.shade_rgb(rgb, landscape)

ax.plot_surface(X, Y, landscape,
                linewidth=0,
                antialiased=False,
                facecolors=illuminated_surface)
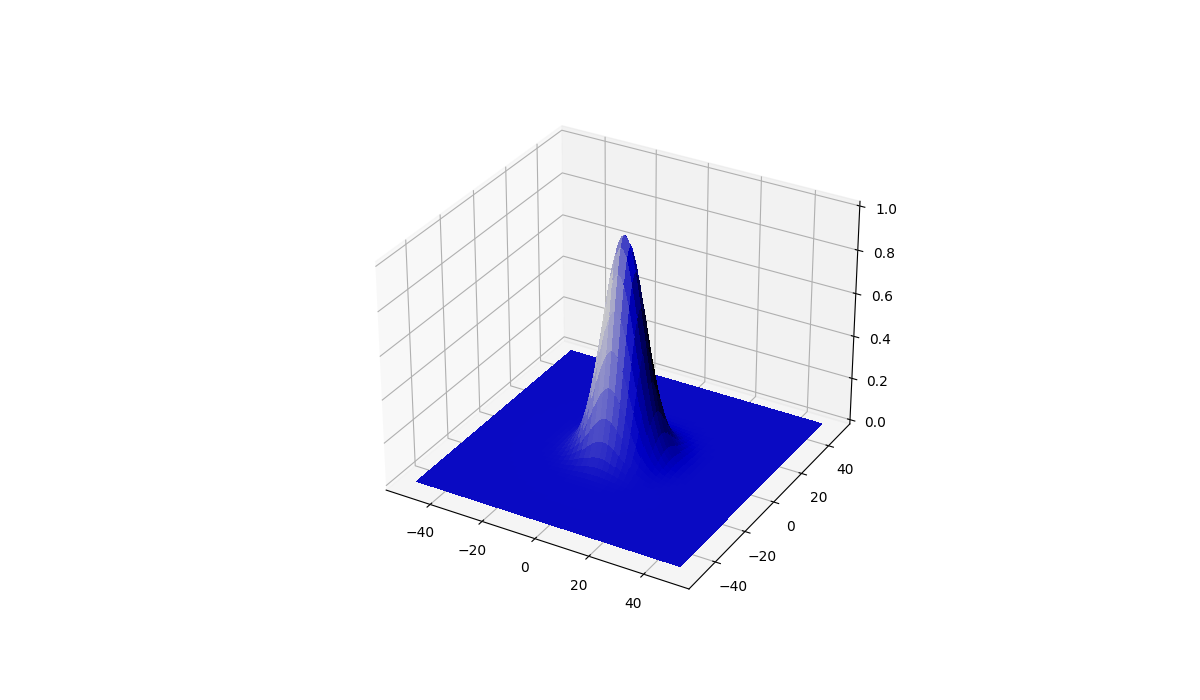
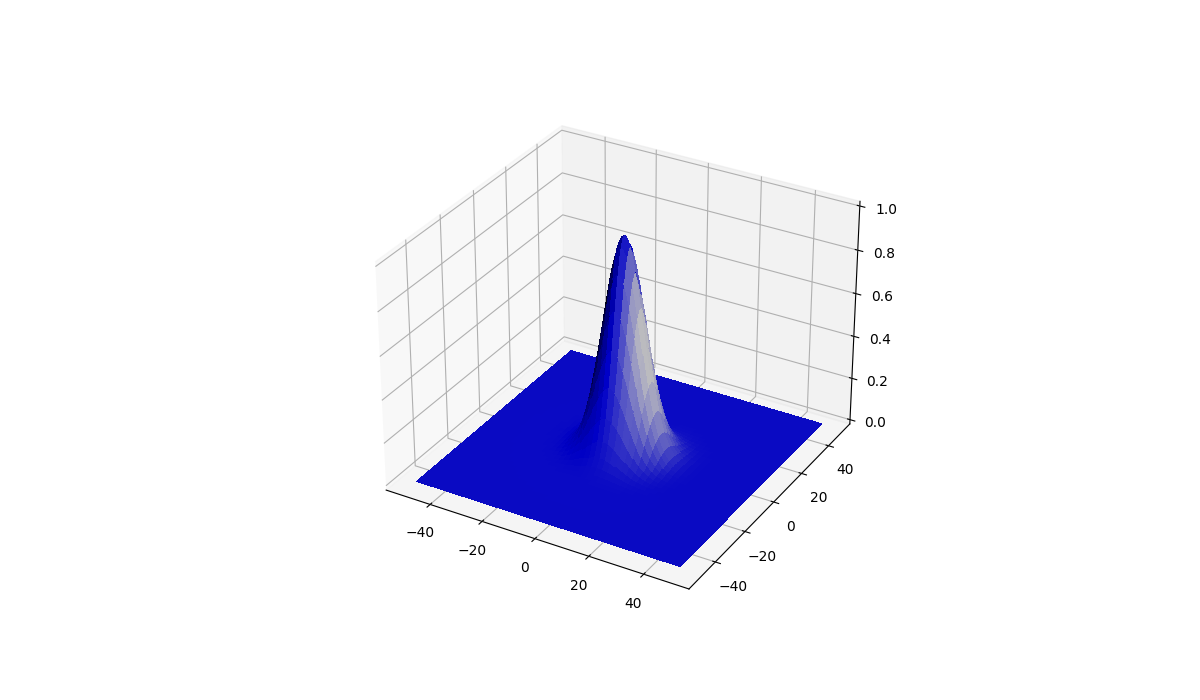
如果您希望从右边发出光线,请更改在创建azdeg时的LightSource参数
ls = LightSource(azdeg=80)
Parameters
    ----------
    azdeg : float, default: 315 degrees (from the northwest)
        The azimuth (0-360, degrees clockwise from North) of the light
        source.
    altdeg : float, default: 45 degrees
        The altitude (0-90, degrees up from horizontal) of the light
source.Stack Overflow用户
发布于 2022-05-19 07:56:27
考虑到Matplotlib的3D功能非常有限,我建议使用不同的库。更好的3D地块库是:
请记住,每个库都有各自的优点和缺点。
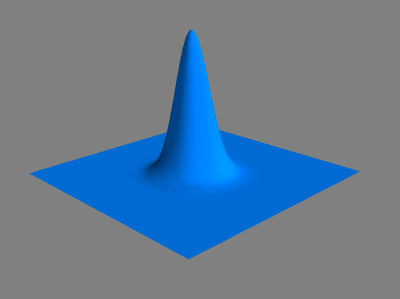
我将用Mayavi复制您的示例,因为我已经在当前环境中安装了它:
import numpy as np
from mayavi import mlab

n = 100
m = 100

x, y = np.mgrid[-n/2:n/2:n*1j,-m/2:m/2:m*1j]
z = np.exp(-0.01 * (x**2 + y**2) )

surf = mlab.surf(x, y, z, warp_scale='auto', color=(0, 0.5, 1))
mlab.show()
https://stackoverflow.com/questions/72299207
复制相似问题
腾讯云开发者

Copyright © 2013 - 2026 Tencent Cloud. All Rights Reserved. 腾讯云 版权所有
深圳市腾讯计算机系统有限公司 ICP备案/许可证号:粤B2-20090059 ![]() 粤公网安备44030502008569号
粤公网安备44030502008569号
腾讯云计算(北京)有限责任公司 京ICP证150476号 | 京ICP备11018762号