
按R的比例或百分比顺序排列堆叠的桶形图
按R的比例或百分比顺序排列堆叠的桶形图
提问于 2022-05-18 13:23:46
我可以根据计数来排序我的情节,但不能按比例排序。我想按"c“的比例排列x轴上的条子。这是我的密码
long<- data.frame(
      Name = c("abc","abc","abc","gif","gif","gif","xyz","xyz","xyz"),
      variable = c("a","b","c","a","b","c","c","b","a"),
      value = c(4,6,NA,2,8,1,6,NA,NA))


long_totals <- long %>%
      group_by(Name) %>%
      summarise(Total = sum(value, na.rm = T))

        p<-long %>%
    mutate(variable = fct_relevel(variable, c("c", "b", "a"))) %>%
                  arrange(variable) %>%
                  mutate(Name = fct_inorder(Name))

                  p %>%
                  ggplot() +
                  aes(x = Name,
                      y = value,
                      fill = variable) +
                  geom_bar(position = "fill",
                           stat = "summary") +
                  geom_text(data = long_totals,
                            aes(y = 100,
                                x = Name,
                                label = Total),
                            size = 7,
                            position = position_fill(vjust = 1.02)) +
                  scale_y_continuous(labels = scales::percent_format())
此外,我正在使用geom_text绘制总数。
回答 1
Stack Overflow用户
回答已采纳
发布于 2022-05-18 13:34:32
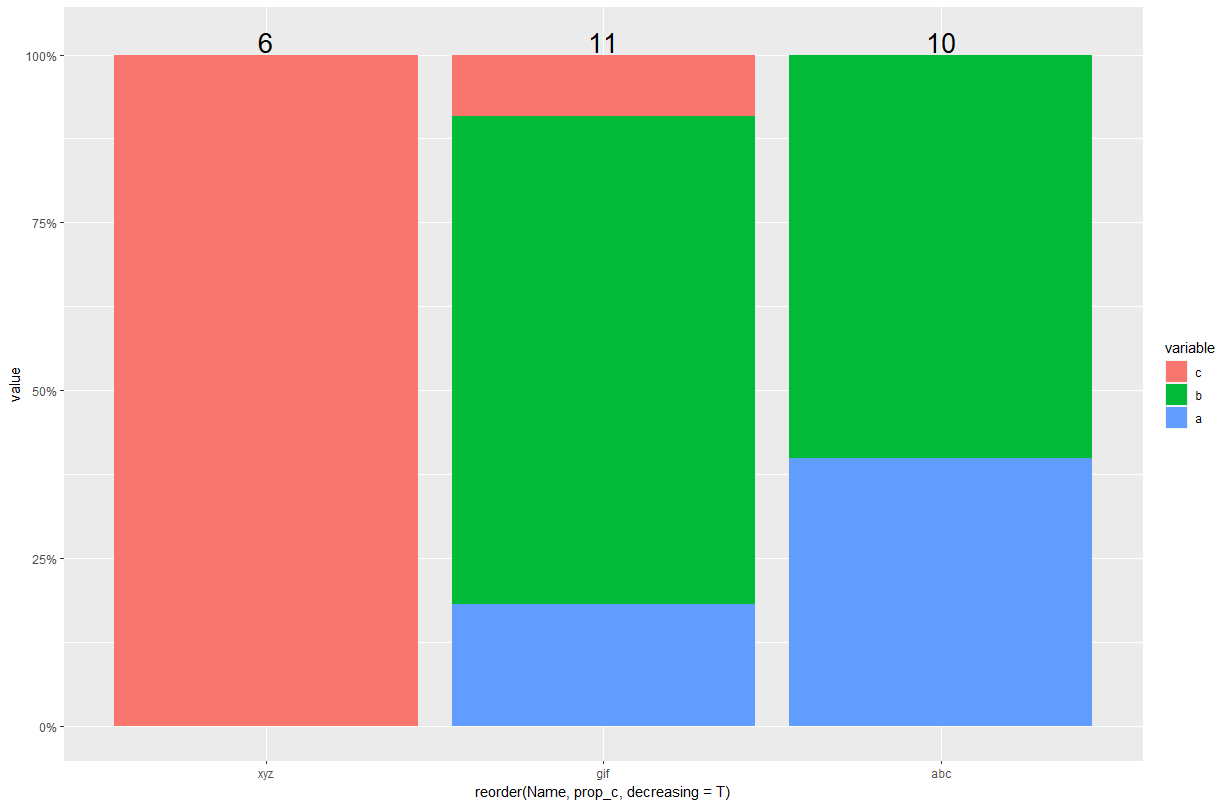
生成p时,按组添加比例c
... %>%
  group_by(Name) %>%
mutate(prop_c = sum(value[variable=="c"], na.rm=T)/sum(value, na.rm=T))然后用reorder绘图
ggplot() +
  geom_col(data= p,aes(x = reorder(Name,prop_c, decreasing=T),y = value,fill = variable),position = "fill") +
  geom_text(data = long_totals, aes(y = 100,x = Name,label = Total),size = 7,position = position_fill(vjust = 1.02)) +
  scale_y_continuous(labels = scales::percent_format())
页面原文内容由Stack Overflow提供。腾讯云小微IT领域专用引擎提供翻译支持
原文链接:
https://stackoverflow.com/questions/72290048
复制相关文章
相似问题
腾讯云开发者

Copyright © 2013 - 2026 Tencent Cloud. All Rights Reserved. 腾讯云 版权所有
深圳市腾讯计算机系统有限公司 ICP备案/许可证号:粤B2-20090059 ![]() 粤公网安备44030502008569号
粤公网安备44030502008569号
腾讯云计算(北京)有限责任公司 京ICP证150476号 | 京ICP备11018762号