
在R中进行分层自举线性回归?
在R中进行分层自举线性回归?
提问于 2022-05-17 10:10:00
在我的模型中,x是范畴变量,有3类: 0,1 & 2,其中0是引用范畴。但是0类比其他类别大(1,2),所以为了避免有偏差的样本,我想要分层引导,但是找不到任何相关的方法。
df <- data.frame (x  = c(0,0,0,0,0,1,1,2,2),
                  y = c(10,11,10,10,12,17,16,20,19),
                  m = c(6,5,6,7,2,10,14,8,11)
                  )
df$x <- as.factor(df$x)
df$x <- relevel(df$x,ref = "0")


fit <- lm(y ~ x*m, data = df)

summary(fit)回答 1
Stack Overflow用户
回答已采纳
发布于 2022-05-17 11:06:42
在注释中扩展Roland的答案,您可以使用boot.ci从引导过程中获取信任区间
library(boot)
b <- boot(df, \(DF, i) coef(lm(y ~ x*m, data = df[i,])), strata = df$x, R = 999)
result <- do.call(rbind, lapply(seq_along(b$t0), function(i) {
m <- boot.ci(b, type = 'norm', index = i)$normal
data.frame(estimate = b$t0[i], lower = m[2], upper = m[3])
}))
result
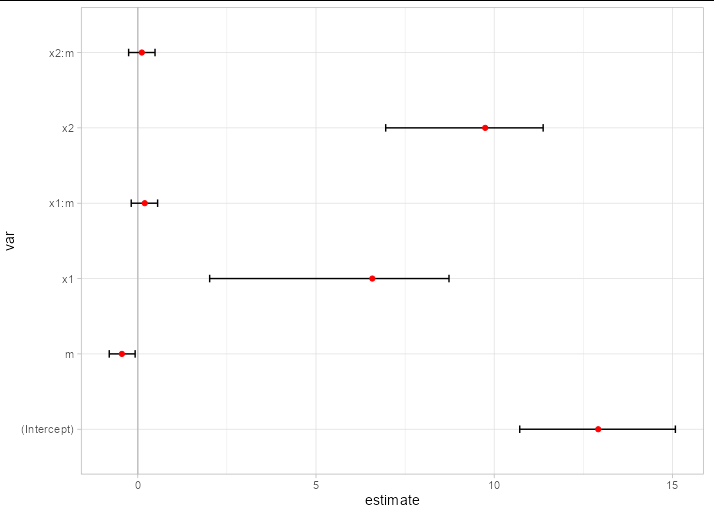
#> estimate lower upper
#> (Intercept) 12.9189189 10.7166127 15.08403731
#> x1 6.5810811 2.0162637 8.73184665
#> x2 9.7477477 6.9556841 11.37390826
#> m -0.4459459 -0.8010925 -0.07451434
#> x1:m 0.1959459 -0.1842914 0.55627896
#> x2:m 0.1126126 -0.2572955 0.48352616甚至把结果画成这样:
ggplot(within(result, var <- rownames(result)), aes(estimate, var)) +
  geom_vline(xintercept = 0, color = 'gray') +
  geom_errorbarh(aes(xmin = lower, xmax = upper), height = 0.1) +
  geom_point(color = 'red') +
  theme_light()
页面原文内容由Stack Overflow提供。腾讯云小微IT领域专用引擎提供翻译支持
原文链接:
https://stackoverflow.com/questions/72272085
复制相关文章
相似问题
腾讯云开发者

Copyright © 2013 - 2026 Tencent Cloud. All Rights Reserved. 腾讯云 版权所有
深圳市腾讯计算机系统有限公司 ICP备案/许可证号:粤B2-20090059 ![]() 粤公网安备44030502008569号
粤公网安备44030502008569号
腾讯云计算(北京)有限责任公司 京ICP证150476号 | 京ICP备11018762号