
如何利用时钟外的动态循环创建时钟可视化?
如何利用时钟外的动态循环创建时钟可视化?
提问于 2022-05-15 19:35:07

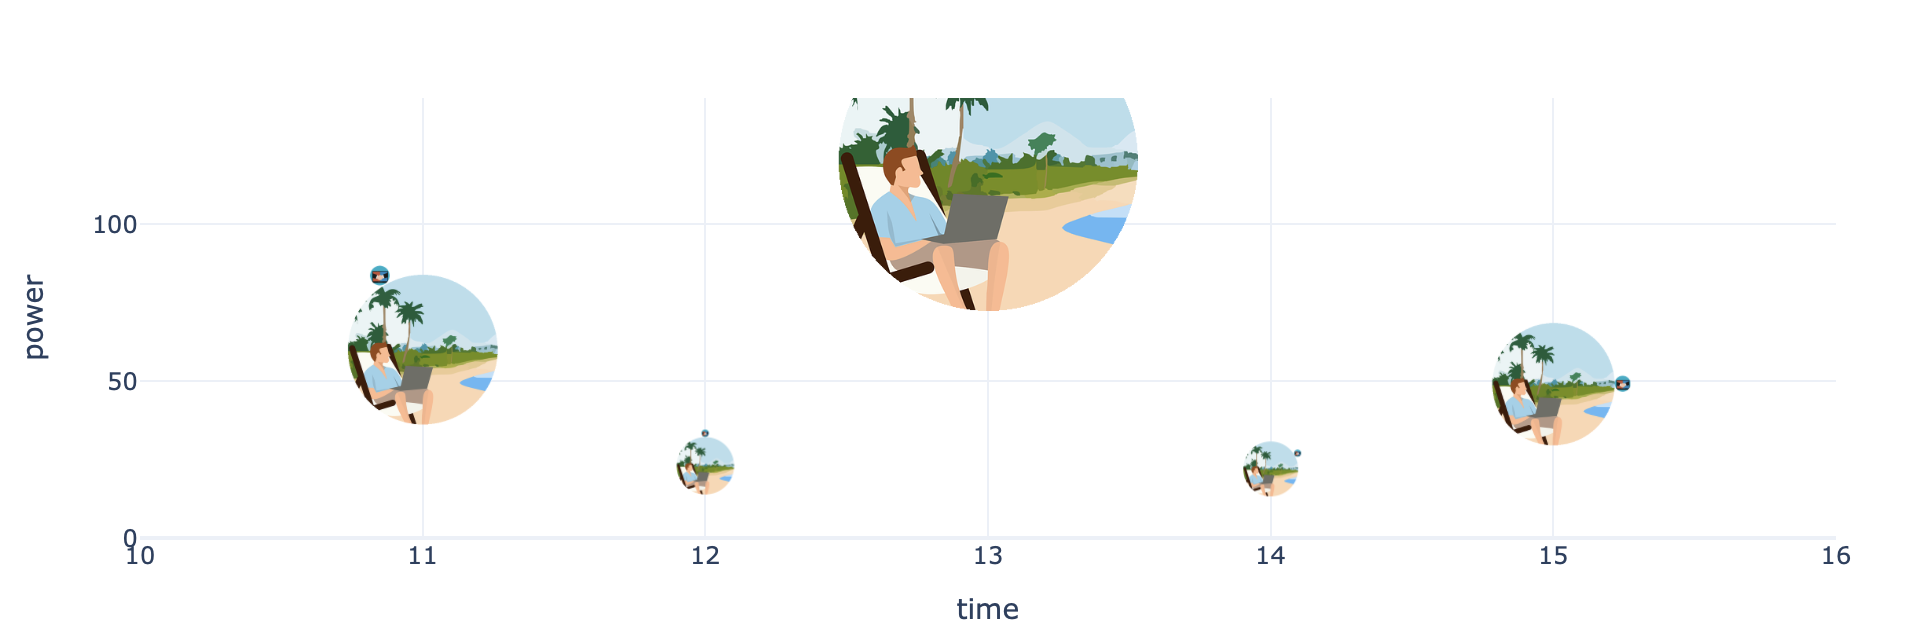
我想创建一个时钟可视化,如上面的图片。一条动态线路将显示使用颜色的时间消耗功率。我想把一个设备的图像放在这条线上,图表根据时间和颜色的变化根据功率值移动。有人能帮我吗?我在下面分享一个小数据集。
data= {'device': {0: 'Laptop', 1: 'Laptop', 2: 'Laptop', 3: 'Laptop', 4: 'Laptop'},
      'power': {0: 60, 1: 23, 2: 120, 3: 22, 4: 49},
      'time': {0: '16/11/2012 11:29',
      1: '16/11/2012 12:30',
      2: '16/11/2012 13:31',
      3: '16/11/2012 14:32',
      4: '16/11/2012 15:33'},
      'time_string': {0: '16/11/2012 11:29',
      1: '16/11/2012 11:30',
      2: '16/11/2012 11:31',
      3: '16/11/2012 11:32',
      4: '16/11/2012 11:33'},
      'x': {0: 0.17, 1: 0.17, 2: 0.17, 3: 0.17, 4: 0.17},
'y': {0: 0.48, 1: 0.48, 2: 0.48, 3: 0.48, 4: 0.48}}回答 1
Stack Overflow用户
发布于 2022-05-16 16:41:11
- 您还没有为
- 提供太多内容,您可以动态构建映像。使用高中三角图在基于hour
- 的图像周围放置和图像,然后所有这些都可以集成到巧妙地图形中,这是从您应用于询问
- 的标记中得到的,我发现
add_layout_image()并不适用于日期/时间轴
。
import pandas as pd
import plotly.express as px
from PIL import Image, ImageOps, ImageDraw
import requests, math
from io import BytesIO


def make_circle(im, buffer=0):
    x, y = im.size
    size = min(x, y)
    new_im = Image.new("RGBA", (size, size))
    new_im.paste(im, (int((size - x) / 2), int((size - y) / 2)))
    mask = Image.new("L", (size, size), 0)
    draw = ImageDraw.Draw(mask)
    draw.ellipse((0, 0) + (size, size), fill=255, outline=0, width=buffer)
    new_im.putalpha(mask)
    return new_im


def hour_to_angle(hour, degree=False):
    angle = hour * (360 / 12) - 90
    return angle if degree else math.radians(angle)


url = [
    "https://cdn.pixabay.com/photo/2017/10/28/21/39/cartoon-2898206__480.png",
    "https://cdn.pixabay.com/photo/2021/03/09/10/05/laptop-6081424_1280.png",
]

# fmt: off
data= {'device': {0: 'Laptop', 1: 'Laptop', 2: 'Laptop', 3: 'Laptop', 4: 'Laptop'},
      'power': {0: 60, 1: 23, 2: 120, 3: 22, 4: 49},
      'time': {0: '16/11/2012 11:29',
      1: '16/11/2012 12:30',
      2: '16/11/2012 13:31',
      3: '16/11/2012 14:32',
      4: '16/11/2012 15:33'},
      'time_string': {0: '16/11/2012 11:29',
      1: '16/11/2012 11:30',
      2: '16/11/2012 11:31',
      3: '16/11/2012 11:32',
      4: '16/11/2012 11:33'},
      'x': {0: 0.17, 1: 0.17, 2: 0.17, 3: 0.17, 4: 0.17},
      'y': {0: 0.48, 1: 0.48, 2: 0.48, 3: 0.48, 4: 0.48}}
# fmt: on

df = pd.DataFrame(data)
df["time"] = pd.to_datetime(df["time"]).dt.hour

fig = px.scatter(df, x="time", y="power")

# marker that is placed on image based on time
im_marker = make_circle(Image.open(BytesIO(requests.get(url[1]).content)))
im_marker.thumbnail(size=(50, 50))
for i, (x, y) in df[["time", "power"]].iterrows():
    im = make_circle(Image.open(BytesIO(requests.get(url[0]).content)), buffer=50)
    theta = hour_to_angle(x)
    r = int(im.size[0] * 0.45)
    c = im.size[0] // 2
    im.paste(
        im_marker,
        (
            int(c + math.cos(theta) * r) - im_marker.size[0] // 2,
            int(c + math.sin(theta) * r) - im_marker.size[0] // 2,
        ),
        im_marker,
    )

    # size custom image based on power and add to figure
    fig.add_layout_image(
        x=x,
        y=y,
        source=im,
        xref="x",
        yref="y",
        sizex=y,
        sizey=y,
        xanchor="center",
        yanchor="middle",
    )

fig.update_layout(
    xaxis_range=[10, 16],
    yaxis_range=[0, 140],
    template="plotly_white",
)
页面原文内容由Stack Overflow提供。腾讯云小微IT领域专用引擎提供翻译支持
原文链接:
https://stackoverflow.com/questions/72251609
复制相关文章
相似问题
腾讯云开发者

Copyright © 2013 - 2026 Tencent Cloud. All Rights Reserved. 腾讯云 版权所有
深圳市腾讯计算机系统有限公司 ICP备案/许可证号:粤B2-20090059 ![]() 粤公网安备44030502008569号
粤公网安备44030502008569号
腾讯云计算(北京)有限责任公司 京ICP证150476号 | 京ICP备11018762号