
在Chart.js中更改低于特定值的线条颜色
在Chart.js中更改低于特定值的线条颜色
提问于 2022-05-10 21:45:53
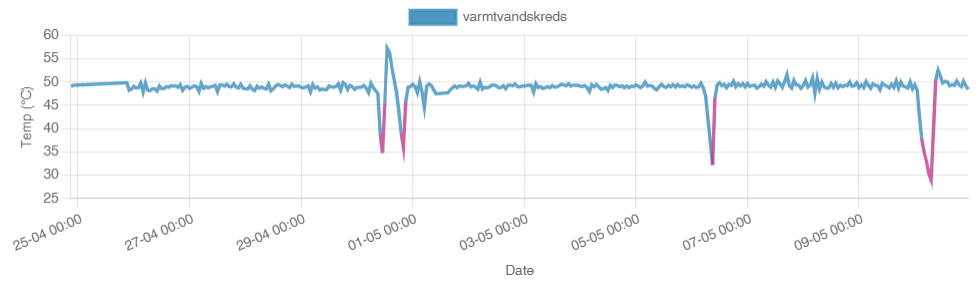
我试图把这条线涂在一个特定的值以下,一个特定的颜色。我使用的是Chart.js v3.7.1
我已经成功地实现了在this answer中找到的解决方案.
 let posColour= 'rgb(86,188,77)';
 let negColour= 'rgb(229,66,66)';
 let config = {
                type: 'line',
                data: {
                    labels: labels,
                    datasets: [{
                        label: tempData.sensorName,
                        data: data,
                        backgroundColor: 'rgba(60,141,188,0.9)',
                        borderColor: posColour,
                        pointRadius: false,
                        pointColor: '#3b8bba',
                        pointStrokeColor: posColour,
                        pointHighlightFill: '#fff',
                        pointHighlightStroke: posColour,
                        segment: {
                            borderColor: (ctx2) => (ctx2.chart.data.datasets[0].data[ctx2.p0DataIndex] < 40 ? negColour : posColour)
                        }

                    }]
                }
                 /*  items below here are not necessary to reproduce the issue  */
                 ,
                options: {
                    reponsive: true,
                    scales: {
                        x: {
                            type: 'time',
                            time: {
                                displayFormats: timeFormat,
                                format: 'day'
                            },
                            ticks: {
                                major: {
                                    enabled: true
                                },
                                maxTicksLimit: 15
                            },
                            title: {
                                display: true,
                                text: 'Date'
                            }
                        },
                        y: {
                            title: {
                                display: true,
                                text: 'Temp (\u00b0C)'
                            }
                        }
                    }
                }
                 /*  items above here are not necessary to reproduce the issue  */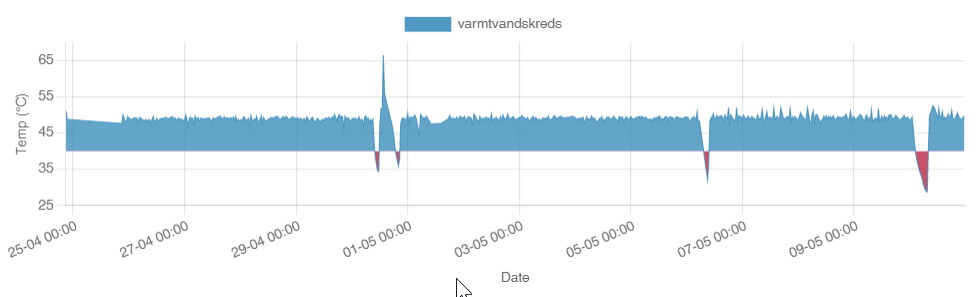
}我知道我可以非常simply with a fill,但是倒转区域图的可见影响不是我正在寻找的视觉效果。
我正在寻找类似this answer的东西,但我无法让最后两行工作(我对ChartJS还不够熟悉)。
let posColour= 'rgb(86,188,77)';
let negColour= 'rgb(229,66,66)';

plugins: [{
  beforeRender: (x, options) => {
    const c = x.chartArea; //tweaked for chart.js3
    const dataset = x.data.datasets[0];
    const yScale = x.scales.y; //tweaked for chart.js3
    const yPos = yScale.getPixelForValue(40); //I want everything under 40 red, not 0 as the original answer...

    const gradientFill = c.ctx.createLinearGradient(0, 0, 0, c.height);
    gradientFill.addColorStop(0, posColour);
    gradientFill.addColorStop(yPos / c.height, posColour);
    gradientFill.addColorStop(yPos / c.height, negColour);
    gradientFill.addColorStop(1, negColour);

    //these two lines are the ones i can't figure out how to convert to chart.js3...
    const model = x.data.datasets[0]._meta[Object.keys(dataset._meta)[0]].dataset._model;
    model.borderColor = gradientFill;
  },
}];
回答 2
Stack Overflow用户
发布于 2022-05-13 12:07:43
这个answer提供的解决方案可以很容易地适应于Chart.js v3.7.1。
请看下面运行的代码,看看它是如何工作的。
const threshold = 25;

new Chart('myChart', {
  type: 'line',
  plugins: [{
    afterLayout: chart => {
      let ctx = chart.ctx;
      ctx.save();
      let yAxis = chart.scales.y;
      let yThreshold = yAxis.getPixelForValue(threshold);
      let gradient = ctx.createLinearGradient(0, yAxis.top, 0, yAxis.bottom);
      gradient.addColorStop(0, 'green');
      let offset = 1 / yAxis.bottom * yThreshold;
      gradient.addColorStop(offset, 'green');
      gradient.addColorStop(offset, 'red');
      gradient.addColorStop(1, 'red');
      chart.data.datasets[0].borderColor = gradient;
      ctx.restore();
    }
  }],
  data: {
    labels: ['A', 'B', 'C', 'D', 'E', 'F', 'G'],
    datasets: [{
      label: 'My Dataset',
      data: [32, 44, 29, 33, 18, 15, 30],
      fill: false,
      lineTension: 0.2
    }]
  },
  options: {
    plugins: {
      legend: {
        display: false
      }
    }
  }
});<script src="https://cdnjs.cloudflare.com/ajax/libs/Chart.js/3.7.1/chart.min.js"></script>
<canvas id="myChart" height="80"></canvas>
Stack Overflow用户
发布于 2022-07-29 09:30:46
我已经做了一个详细的答复,here,可以帮助你。
以下是代码:
var myLineChart = new Chart(ctx, {
  type: 'line',
  plugins: [{
    afterLayout: chart => {
      let ctx = chart.chart.ctx;
      ctx.save();
      let yAxis = chart.scales["y-axis-0"];
      let yThresholdMax = yAxis.getPixelForValue(data.limits.max);
      let yThresholdMin = yAxis.getPixelForValue(data.limits.min);

      let offsetMax = 1 / yAxis.bottom * yThresholdMax;
      let offsetMin= 1 / yAxis.bottom * yThresholdMin;

      let gradient = ctx.createLinearGradient(0, yAxis.top, 0, yAxis.bottom);

      gradient.addColorStop(0, 'red');
      gradient.addColorStop(offsetMax, 'darkred');
      gradient.addColorStop(offsetMax, 'blue');
      gradient.addColorStop(offsetMin, 'blue');
      gradient.addColorStop(offsetMin,'darkred');
      gradient.addColorStop(1,"red");
      chart.data.datasets[0].borderColor = gradient;
      ctx.restore();
    }
  }],
  // The data for our dataset
  data: {
      ......
  },
    options: {
    ........
   }
});页面原文内容由Stack Overflow提供。腾讯云小微IT领域专用引擎提供翻译支持
原文链接:
https://stackoverflow.com/questions/72193266
复制相关文章
相似问题
腾讯云开发者

Copyright © 2013 - 2026 Tencent Cloud. All Rights Reserved. 腾讯云 版权所有
深圳市腾讯计算机系统有限公司 ICP备案/许可证号:粤B2-20090059 ![]() 粤公网安备44030502008569号
粤公网安备44030502008569号
腾讯云计算(北京)有限责任公司 京ICP证150476号 | 京ICP备11018762号