
有色调和无色调的海选配对
我正在绘制一个数据,作为一个配对和拟合低空线使用重新绘制在海上。我使用了hue = "variable",但希望看到整个数据(非色调)上的低空线也安装在相同的配对图中。我希望在这个问题上有任何帮助或建议。
pg = sns.pairplot(df, hue="variable", plot_kws={'alpha':0.015})
a = pg.map(sns.regplot, lowess=True, scatter_kws={'alpha':0.03})
回答 1
Stack Overflow用户
发布于 2022-05-10 15:11:07
让我们用自定义函数替换sns.regplot,例如plot_extra。
pg.map将为每个子图的每个色调值调用plot_extra一次。它将传递以下参数:
label:此callx和y的色调值的名称:此子图的列,仅限于当前色调值- 调用中给出的额外参数。
要绘制完整数据的regplot,可以将数据作为额外的参数。为了防止对每个色调值一次又一次地执行相同的函数,该函数可以在标签上进行测试,并且只对一个特定的标签进行进一步的测试。.name of x和y可用于指示要绘制哪些列。.map()将调用每个子图,而.map_offdiag()将仅限于不位于对角线上的子图。
可以更新图例:从现有的pairplot图例中提取信息,并添加对正则图行的引用。
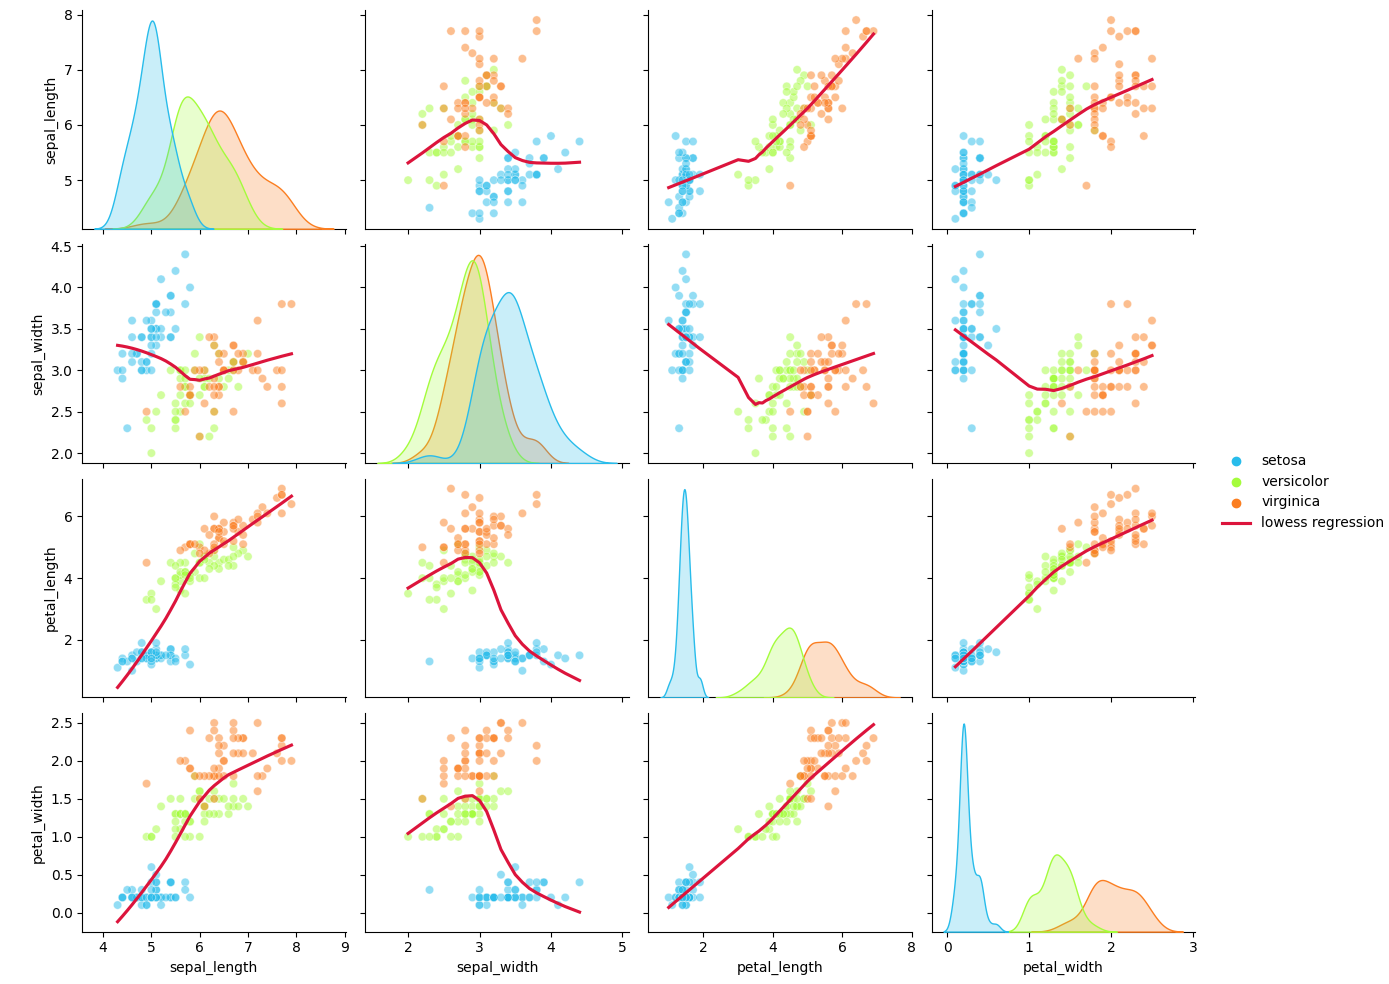
下面是一个使用标准虹膜数据集的示例。
import matplotlib.pyplot as plt
import seaborn as sns

def plot_extra(x, y, **kwargs):
     if kwargs['label'] == first_label:
          sns.regplot(data=kwargs['data'], x=x.name, y=y.name, lowess=True, scatter=False, color=kwargs['color'])

df = sns.load_dataset('iris')

first_label = df['species'][0]
pg = sns.pairplot(df, hue='species', plot_kws={'alpha': 0.5}, palette='turbo')

pg.map_offdiag(plot_extra, color='crimson', data=df)

legend_dict = {h.get_label(): h for h in pg.legend.legendHandles}  # the existing legend items
legend_dict['lowess regression'] = pg.axes[0, 1].lines[
     0]  # add the first line object of a non-diagonal ax to the legend

pg.legend.remove()  # remove existing legend
pg.add_legend(legend_dict, label_order=legend_dict.keys(), title='')  # create the new legend
plt.show()
https://stackoverflow.com/questions/72179957
复制相似问题
腾讯云开发者

Copyright © 2013 - 2026 Tencent Cloud. All Rights Reserved. 腾讯云 版权所有
深圳市腾讯计算机系统有限公司 ICP备案/许可证号:粤B2-20090059 ![]() 粤公网安备44030502008569号
粤公网安备44030502008569号
腾讯云计算(北京)有限责任公司 京ICP证150476号 | 京ICP备11018762号