
管理背页中的多行
管理背页中的多行
提问于 2022-05-05 09:19:30
我创建了一个具有多列和多行参数的表,如下所示
\begin{table}[H]
\centering
\begin{tabular}{lccccc}
\hline
\multirow{2}{*}{Aspects} & Probability & \multicolumn{4}{c}{Methods} \\
\cline{3-6}
& for DE Genes          & Binomial Test & Tangram & stereoscope & BayesPrism\\
\hline
\multirow{3}{*}{AUC}  & 0.3   & 0.867 & 0.029 & 0.074 & 0.992 \\
                  & 0.1   & 0.722 & 0.023 & 0.015 & 0.987\\
                  & 0.05  & 0.512 & 0.055 & 0.025 & 0.972\\
\hline
\multirow{3}{*}{Best Thresholds} & 0.3   & ${0.135$ & 0.029 & 0.072 & $1e-10$ \\
                             & 0.1   & ${1e-60$ & 0.026 & 0.065 & $1e-10$\\
                             & 0.05  & $1e-60$ & 0.033 & 0.069 & $1e-10$\\
\hline
\end{tabular}
\caption{The ROC Curve Summary for Data with 15 Clusters}
\label{15 cluster summary}
\end{table}
它会给出这样的结果
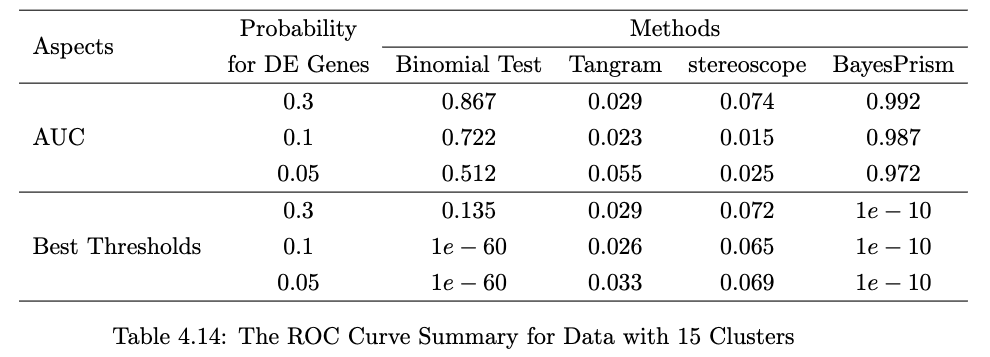
我想让条目“最佳阈值”放在两行(填充3行参数),这样表就不会太宽。有人能帮上忙吗?
回答 1
Stack Overflow用户
发布于 2022-05-19 15:32:03
您可以将文本放在\parbox中。
\documentclass{article}

\usepackage{multirow}

\begin{document}


\begin{table}[htbp]
\centering
\begin{tabular}{lccccc}
\hline
\multirow{2}{*}{Aspects} & Probability & \multicolumn{4}{c}{Methods} \\
\cline{3-6}
& for DE Genes          & Binomial Test & Tangram & stereoscope & BayesPrism\\
\hline
\multirow{3}{*}{AUC}  & 0.3   & 0.867 & 0.029 & 0.074 & 0.992 \\
                  & 0.1   & 0.722 & 0.023 & 0.015 & 0.987\\
                  & 0.05  & 0.512 & 0.055 & 0.025 & 0.972\\
\hline
\multirow{3}{*}{\parbox{2cm}{\raggedright Best Thresholds}} & 0.3   & $0.135$ & 0.029 & 0.072 & $1e-10$ \\
                             & 0.1   & $1e-60$ & 0.026 & 0.065 & $1e-10$\\
                             & 0.05  & $1e-60$ & 0.033 & 0.069 & $1e-10$\\
\hline
\end{tabular}
\caption{The ROC Curve Summary for Data with 15 Clusters}
\label{15 cluster summary}
\end{table}


\end{document}页面原文内容由Stack Overflow提供。腾讯云小微IT领域专用引擎提供翻译支持
原文链接:
https://stackoverflow.com/questions/72124789
复制相关文章
相似问题
腾讯云开发者

Copyright © 2013 - 2026 Tencent Cloud. All Rights Reserved. 腾讯云 版权所有
深圳市腾讯计算机系统有限公司 ICP备案/许可证号:粤B2-20090059 ![]() 粤公网安备44030502008569号
粤公网安备44030502008569号
腾讯云计算(北京)有限责任公司 京ICP证150476号 | 京ICP备11018762号