
R基于用户输入和更新图的闪亮过滤数据
R基于用户输入和更新图的闪亮过滤数据
提问于 2022-05-02 20:22:05
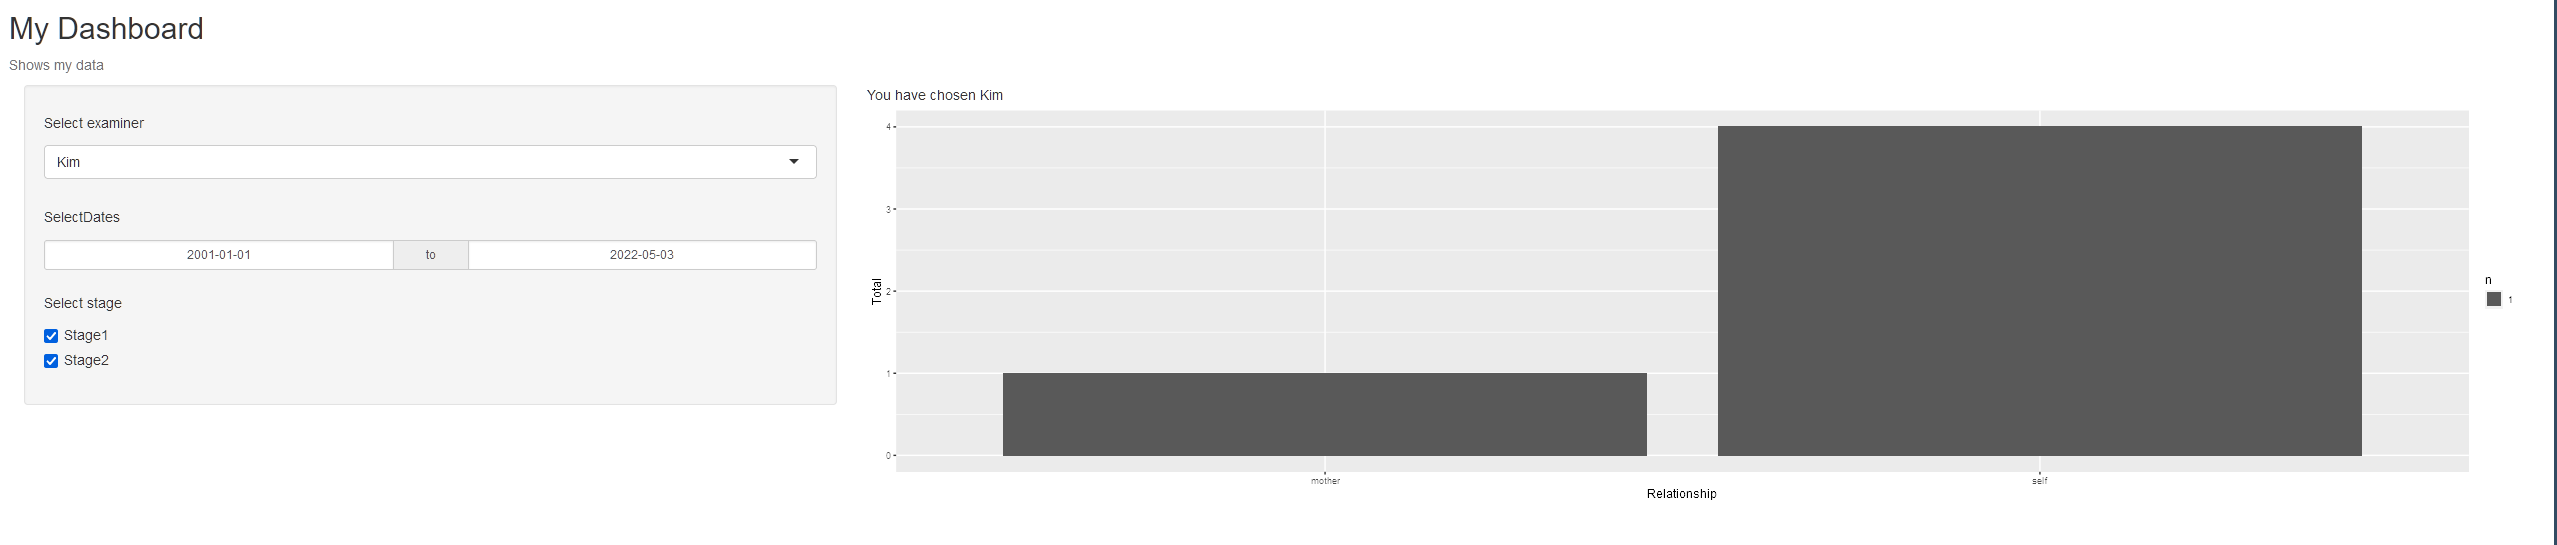
我有一个闪亮的应用程序,我过滤的数据基于3个用户输入(下拉,日期和复选框)。如何根据用户选择更新情节。示例,当未选中复选框时,不要显示绘图。此外,如何基于复选框对绘图进行着色,selection.Also是否有一种方法可以将所有数据绘制为默认屏幕,检查器在x轴上,总和在y轴中。
mydata<-structure(list(Id = structure(c(1L, 11L, 19L, 27L, 28L, 29L,
30L, 31L, 2L, 3L, 4L, 5L, 6L, 7L, 8L, 9L, 10L, 12L, 13L, 14L,
15L, 16L, 17L, 18L, 20L, 21L, 22L, 23L, 24L, 25L, 26L), .Label = c("DB-1",
"DB-11", "DB-12", "DB-13", "DB-14", "DB-15", "DB-16", "DB-17",
"DB-18", "DB-19", "DB-2", "DB-20", "DB-23", "DB-25", "DB-26",
"DB-27", "DB-28", "DB-29", "DB-3", "DB-30", "DB-31", "DB-32",
"DB-34", "DB-35", "DB-36", "DB-37", "DB-4", "DB-5", "DB-6", "DB-7",
"DB-9"), class = "factor"), examiner = structure(c(1L, 1L, 1L,
1L, 1L, 1L, 3L, 3L, 3L, 3L, 3L, 1L, 1L, 2L, 2L, 2L, 2L, 2L, 2L,
4L, 4L, 4L, 4L, 4L, 5L, 5L, 5L, 5L, 5L, 5L, 5L), .Label = c("Alex",
"Jhon", "Kim", "Maymoon", "Mike"), class = "factor"), Relationship = structure(c(4L,
2L, 3L, 1L, 3L, 3L, 3L, 3L, 3L, 2L, 3L, 3L, 3L, 3L, 2L, 1L, 3L,
3L, 2L, 3L, 3L, 3L, 3L, 4L, 1L, 2L, 2L, 2L, 2L, 3L, 1L), .Label = c("father",
"mother", "self", "sibling"), class = "factor"), application_date = structure(c(10L,
6L, 8L, 3L, 6L, 3L, 7L, 15L, 20L, 2L, 20L, 3L, 14L, 11L, 2L,
8L, 10L, 5L, 20L, 14L, 13L, 11L, 17L, 12L, 1L, 16L, 19L, 9L,
18L, 21L, 4L), .Label = c("1/10/19", "1/15/19", "11/13/18", "11/15/18",
"11/20/18", "11/27/18", "11/28/18", "11/30/18", "12/20/18", "12/4/18",
"12/6/18", "12/7/18", "2/14/19", "2/25/19", "2/26/19", "3/12/19",
"3/14/19", "3/21/19", "3/22/19", "4/3/19", "4/5/19"), class = "factor"),
    gender = structure(c(2L, 1L, 2L, 2L, 2L, 2L, 1L, 1L, 1L,
    1L, 2L, 1L, 1L, 1L, 1L, 2L, 2L, 1L, 1L, 1L, 2L, 2L, 1L, 2L,
    2L, 1L, 1L, 1L, 1L, 1L, 2L), .Label = c("female", "male"), class = "factor"),
    stage1_date = structure(c(8L, 3L, 6L, 2L, 3L, 7L, 3L, 10L,
    13L, 11L, 13L, 2L, 10L, 3L, 11L, 5L, 1L, 3L, 7L, 17L, 12L,
    1L, 14L, 9L, 5L, 16L, 15L, 4L, 16L, 1L, 3L), .Label = c("",
    "1/10/19 21:40", "1/10/19 21:45", "1/17/19 19:26", "1/31/19 20:25",
    "1/9/19 19:50", "1/9/20 14:50", "2/21/19 21:15", "2/6/19 20:36",
    "3/15/19 16:50", "3/21/19 18:21", "3/4/19 16:30", "4/26/19 19:20",
    "4/8/19 12:40", "4/8/19 12:41", "5/1/19 18:05", "7/30/19 15:10"
    ), class = "factor"), stage2_date = structure(c(1L, 1L, 1L,
    1L, 4L, 1L, 9L, 1L, 2L, 1L, 10L, 7L, 8L, 1L, 1L, 1L, 5L,
    1L, 1L, 6L, 2L, 5L, 1L, 1L, 1L, 1L, 1L, 1L, 1L, 3L, 1L), .Label = c("",
    "5/11/21 17:37", "5/11/21 17:42", "5/11/21 17:50", "5/11/21 17:52",
    "5/14/21 16:07", "5/15/21 16:07", "5/16/21 16:07", "5/21/21 17:46",
    "5/21/21 17:47"), class = "factor"), status_stage1_2019 = c(1L,
    1L, 1L, 1L, 1L, 0L, 1L, 1L, 1L, 1L, 1L, 1L, 1L, 1L, 1L, 1L,
    0L, 1L, 0L, 1L, 1L, 0L, 1L, 1L, 1L, 1L, 1L, 1L, 1L, 0L, 1L
    ), status_stage1_2020 = c(0L, 0L, 0L, 0L, 0L, 1L, 0L, 0L,
    0L, 0L, 0L, 0L, 0L, 0L, 0L, 0L, 0L, 0L, 1L, 0L, 0L, 0L, 0L,
    0L, 0L, 0L, 0L, 0L, 0L, 0L, 0L), status_stage1_2021 = c(0L,
    0L, 0L, 0L, 0L, 0L, 0L, 0L, 0L, 0L, 0L, 0L, 0L, 0L, 0L, 0L,
    0L, 0L, 0L, 0L, 0L, 0L, 0L, 0L, 0L, 0L, 0L, 0L, 0L, 0L, 0L
    ), status_stage1_2022 = c(0L, 0L, 0L, 0L, 0L, 0L, 0L, 0L,
    0L, 0L, 0L, 0L, 0L, 0L, 0L, 0L, 0L, 0L, 0L, 0L, 0L, 0L, 0L,
    0L, 0L, 0L, 0L, 0L, 0L, 0L, 0L), status_stage2_2020 = c(0L,
    0L, 0L, 0L, 0L, 0L, 0L, 0L, 0L, 0L, 0L, 0L, 0L, 0L, 0L, 0L,
    0L, 0L, 0L, 0L, 0L, 0L, 0L, 0L, 0L, 0L, 0L, 0L, 0L, 0L, 0L
    ), status_stage2_2021 = c(0L, 0L, 0L, 0L, 1L, 0L, 1L, 0L,
    1L, 0L, 1L, 1L, 1L, 0L, 0L, 0L, 1L, 0L, 0L, 1L, 1L, 1L, 0L,
    0L, 0L, 0L, 0L, 0L, 0L, 1L, 0L), status_stage2_2022 = c(0L,
    0L, 0L, 0L, 0L, 0L, 0L, 0L, 0L, 0L, 0L, 0L, 0L, 0L, 0L, 0L,
    0L, 0L, 0L, 0L, 0L, 0L, 0L, 0L, 0L, 0L, 0L, 0L, 0L, 0L, 0L
    )), class = "data.frame", row.names = c(NA, -31L))
我的代码
server <- function(input, output, session) {
  #Summarize Data and then Plot
  data <- reactive({

    req(input$examiner)

    mydata %>%
      dplyr::filter(
        examiner %in% input$examiner ,
if_any(matches(str_c('status_', tolower(input$stage))), ~
                 .x ==1),
        stage1_date >= input$daterange[1] &
          stage1_date <= input$daterange[2]
      ) %>%
      group_by(Relationship) %>% summarize(Total = n())

  })
output$selected_var <- renderText({
    paste("You have chosen ", input$examiner)
  })
  #Plot
  output$plot <- renderPlot({
    req(data())
    g <- ggplot(data(), aes( y = Total, x = Relationship))
    g + geom_bar(stat = "sum")
  })
}
ui <- basicPage(
  titlePanel("My Dashboard"),
  helpText("Shows my data"),
  sidebarPanel(
    selectInput(inputId = "examiner",
                label = h5("Select examiner"),
                choices = c(as.character(mydata$examiner))
    ),
    dateRangeInput("daterange",
                   h5("SelectDates"),
                   format="yyyy-mm-dd",
                   start = "2001-01-01"
    ),
    checkboxGroupInput("stage",
                  h5("Select stage"),
                  choices = c("Stage1","Stage2"),
                  selected = c("Stage1","Stage2")
                  )
    ),

  mainPanel(
    textOutput("selected_var"),
    plotOutput("plot")

  )
)回答 1
Stack Overflow用户
发布于 2022-05-02 21:06:42
问题是stage1_date,->类,它是因子。使用lubridate的ymd_hm函数将其转换为日期。那么你的代码就能工作了!
只需在my_data %>%后面直接添加这一行代码
library(lubridate)
....
....

    mydata %>%
      mutate(stage1_date = mdy_hm(as.character(stage1_date))) %>%
....
....
下面是工作应用程序的完整代码:
library(shiny)
library(tidyverse)
library(lubridate)


mydata<-structure(list(Id = structure(c(1L, 11L, 19L, 27L, 28L, 29L,
30L, 31L, 2L, 3L, 4L, 5L, 6L, 7L, 8L, 9L, 10L, 12L, 13L, 14L,
15L, 16L, 17L, 18L, 20L, 21L, 22L, 23L, 24L, 25L, 26L), .Label = c("DB-1",
"DB-11", "DB-12", "DB-13", "DB-14", "DB-15", "DB-16", "DB-17",
"DB-18", "DB-19", "DB-2", "DB-20", "DB-23", "DB-25", "DB-26",
"DB-27", "DB-28", "DB-29", "DB-3", "DB-30", "DB-31", "DB-32",
"DB-34", "DB-35", "DB-36", "DB-37", "DB-4", "DB-5", "DB-6", "DB-7",
"DB-9"), class = "factor"), examiner = structure(c(1L, 1L, 1L,
1L, 1L, 1L, 3L, 3L, 3L, 3L, 3L, 1L, 1L, 2L, 2L, 2L, 2L, 2L, 2L,
4L, 4L, 4L, 4L, 4L, 5L, 5L, 5L, 5L, 5L, 5L, 5L), .Label = c("Alex",
"Jhon", "Kim", "Maymoon", "Mike"), class = "factor"), Relationship = structure(c(4L,
2L, 3L, 1L, 3L, 3L, 3L, 3L, 3L, 2L, 3L, 3L, 3L, 3L, 2L, 1L, 3L,
3L, 2L, 3L, 3L, 3L, 3L, 4L, 1L, 2L, 2L, 2L, 2L, 3L, 1L), .Label = c("father",
"mother", "self", "sibling"), class = "factor"), application_date = structure(c(10L,
6L, 8L, 3L, 6L, 3L, 7L, 15L, 20L, 2L, 20L, 3L, 14L, 11L, 2L,
8L, 10L, 5L, 20L, 14L, 13L, 11L, 17L, 12L, 1L, 16L, 19L, 9L,
18L, 21L, 4L), .Label = c("1/10/19", "1/15/19", "11/13/18", "11/15/18",
"11/20/18", "11/27/18", "11/28/18", "11/30/18", "12/20/18", "12/4/18",
"12/6/18", "12/7/18", "2/14/19", "2/25/19", "2/26/19", "3/12/19",
"3/14/19", "3/21/19", "3/22/19", "4/3/19", "4/5/19"), class = "factor"),
gender = structure(c(2L, 1L, 2L, 2L, 2L, 2L, 1L, 1L, 1L,
1L, 2L, 1L, 1L, 1L, 1L, 2L, 2L, 1L, 1L, 1L, 2L, 2L, 1L, 2L,
2L, 1L, 1L, 1L, 1L, 1L, 2L), .Label = c("female", "male"), class = "factor"),
stage1_date = structure(c(8L, 3L, 6L, 2L, 3L, 7L, 3L, 10L,
13L, 11L, 13L, 2L, 10L, 3L, 11L, 5L, 1L, 3L, 7L, 17L, 12L,
1L, 14L, 9L, 5L, 16L, 15L, 4L, 16L, 1L, 3L), .Label = c("",
"1/10/19 21:40", "1/10/19 21:45", "1/17/19 19:26", "1/31/19 20:25",
"1/9/19 19:50", "1/9/20 14:50", "2/21/19 21:15", "2/6/19 20:36",
"3/15/19 16:50", "3/21/19 18:21", "3/4/19 16:30", "4/26/19 19:20",
"4/8/19 12:40", "4/8/19 12:41", "5/1/19 18:05", "7/30/19 15:10"
), class = "factor"), stage2_date = structure(c(1L, 1L, 1L,
1L, 4L, 1L, 9L, 1L, 2L, 1L, 10L, 7L, 8L, 1L, 1L, 1L, 5L,
1L, 1L, 6L, 2L, 5L, 1L, 1L, 1L, 1L, 1L, 1L, 1L, 3L, 1L), .Label = c("",
"5/11/21 17:37", "5/11/21 17:42", "5/11/21 17:50", "5/11/21 17:52",
"5/14/21 16:07", "5/15/21 16:07", "5/16/21 16:07", "5/21/21 17:46",
"5/21/21 17:47"), class = "factor"), status_stage1_2019 = c(1L,
1L, 1L, 1L, 1L, 0L, 1L, 1L, 1L, 1L, 1L, 1L, 1L, 1L, 1L, 1L,
0L, 1L, 0L, 1L, 1L, 0L, 1L, 1L, 1L, 1L, 1L, 1L, 1L, 0L, 1L
), status_stage1_2020 = c(0L, 0L, 0L, 0L, 0L, 1L, 0L, 0L,
0L, 0L, 0L, 0L, 0L, 0L, 0L, 0L, 0L, 0L, 1L, 0L, 0L, 0L, 0L,
0L, 0L, 0L, 0L, 0L, 0L, 0L, 0L), status_stage1_2021 = c(0L,
0L, 0L, 0L, 0L, 0L, 0L, 0L, 0L, 0L, 0L, 0L, 0L, 0L, 0L, 0L,
0L, 0L, 0L, 0L, 0L, 0L, 0L, 0L, 0L, 0L, 0L, 0L, 0L, 0L, 0L
), status_stage1_2022 = c(0L, 0L, 0L, 0L, 0L, 0L, 0L, 0L,
0L, 0L, 0L, 0L, 0L, 0L, 0L, 0L, 0L, 0L, 0L, 0L, 0L, 0L, 0L,
0L, 0L, 0L, 0L, 0L, 0L, 0L, 0L), status_stage2_2020 = c(0L,
0L, 0L, 0L, 0L, 0L, 0L, 0L, 0L, 0L, 0L, 0L, 0L, 0L, 0L, 0L,
0L, 0L, 0L, 0L, 0L, 0L, 0L, 0L, 0L, 0L, 0L, 0L, 0L, 0L, 0L
), status_stage2_2021 = c(0L, 0L, 0L, 0L, 1L, 0L, 1L, 0L,
1L, 0L, 1L, 1L, 1L, 0L, 0L, 0L, 1L, 0L, 0L, 1L, 1L, 1L, 0L,
0L, 0L, 0L, 0L, 0L, 0L, 1L, 0L), status_stage2_2022 = c(0L,
0L, 0L, 0L, 0L, 0L, 0L, 0L, 0L, 0L, 0L, 0L, 0L, 0L, 0L, 0L,
0L, 0L, 0L, 0L, 0L, 0L, 0L, 0L, 0L, 0L, 0L, 0L, 0L, 0L, 0L
)), class = "data.frame", row.names = c(NA, -31L))


server <- function(input, output, session) {
  #Summarize Data and then Plot
  data <- reactive({

    req(input$examiner)

    mydata %>%
      mutate(stage1_date = mdy_hm(as.character(stage1_date))) %>%
      dplyr::filter(
        examiner %in% input$examiner ,
        if_any(matches(str_c('status_', tolower(input$stage))), ~
                 .x ==1),
        stage1_date >= input$daterange[1] &
          stage1_date <= input$daterange[2]
      ) %>%
      group_by(Relationship) %>% summarize(Total = n())

  })
  output$selected_var <- renderText({
    paste("You have chosen ", input$examiner)
  })
  #Plot
  output$plot <- renderPlot({
    req(data())
    g <- ggplot(data(), aes( y = Total, x = Relationship))
    g + geom_bar(stat = "sum")
    #browser()
  })
 # browser()
}
ui <- basicPage(
  titlePanel("My Dashboard"),
  helpText("Shows my data"),
  sidebarPanel(
    selectInput(inputId = "examiner",
                label = h5("Select examiner"),
                choices = c(as.character(mydata$examiner))
    ),
    dateRangeInput("daterange",
                   h5("SelectDates"),
                   format="yyyy-mm-dd",
                   start = "2001-01-01"
    ),
    checkboxGroupInput("stage",
                       h5("Select stage"),
                       choices = c("Stage1","Stage2"),
                       selected = c("Stage1","Stage2")
    )
  ),

  mainPanel(
    textOutput("selected_var"),
    plotOutput("plot")

  )
)

shinyApp(ui, server)
页面原文内容由Stack Overflow提供。腾讯云小微IT领域专用引擎提供翻译支持
原文链接:
https://stackoverflow.com/questions/72091981
复制相关文章
相似问题
腾讯云开发者

Copyright © 2013 - 2026 Tencent Cloud. All Rights Reserved. 腾讯云 版权所有
深圳市腾讯计算机系统有限公司 ICP备案/许可证号:粤B2-20090059 ![]() 粤公网安备44030502008569号
粤公网安备44030502008569号
腾讯云计算(北京)有限责任公司 京ICP证150476号 | 京ICP备11018762号