
geom_line_interactive中的固定工具提示
geom_line_interactive中的固定工具提示
提问于 2022-04-27 14:43:47
我可能错过了一些非常非常明显的东西..。在示例2中,悬停文本显示'1',指定的工具提示列的第一个值,并且不会更改。
我想有一个变化的悬停文本,如在示例1,而不是攻击f.e。颜色为y(如例2)
彩色
- = y
testdf <- data.frame(
  "x" = c(1:10),
  "y" = c(1:10))

test <- testdf %>%
  ggplot2::ggplot() +
  ggiraph::geom_line_interactive(
    ggplot2::aes(x = x,
                 y = y,
                 color = y,
                 tooltip = y)
  )

ggiraph::girafe(ggobj = test,
                height_svg = 3.5,
                options = list(
                  opts_sizing(rescale = T),
                  # Gestaltung des tooltips
                  opts_tooltip(css= "font-family: Helvetica; padding:3pt; color:white; background-color:#15253F; border-radius:5px"),
                  # Zoom
                  opts_zoom(max = 5),
                  # Hover Optionen
                  opts_hover(css = "stroke-width:2;"),
                  opts_hover_inv(css = "opacity:0.8"),
                  opts_toolbar(position = "topright", saveaspng = F)

                ))
无色
- = y
testdf <- data.frame(
  "x" = c(1:10),
  "y" = c(1:10))

test <- testdf %>%
  ggplot2::ggplot() +
  ggiraph::geom_line_interactive(
    ggplot2::aes(x = x,
                 y = y,
                 tooltip = x)
  )

ggiraph::girafe(ggobj = test,
                height_svg = 3.5,
                options = list(
                  opts_sizing(rescale = T),
                  # Gestaltung des tooltips
                  opts_tooltip(css= "font-family: Helvetica; padding:3pt; color:white; background-color:#15253F; border-radius:5px"),
                  # Zoom
                  opts_zoom(max = 5),
                  # Hover Optionen
                  opts_hover(css = "stroke-width:2;"),
                  opts_hover_inv(css = "opacity:0.8"),
                  opts_toolbar(position = "topright", saveaspng = F)

))回答 1
Stack Overflow用户
发布于 2022-05-19 11:36:46
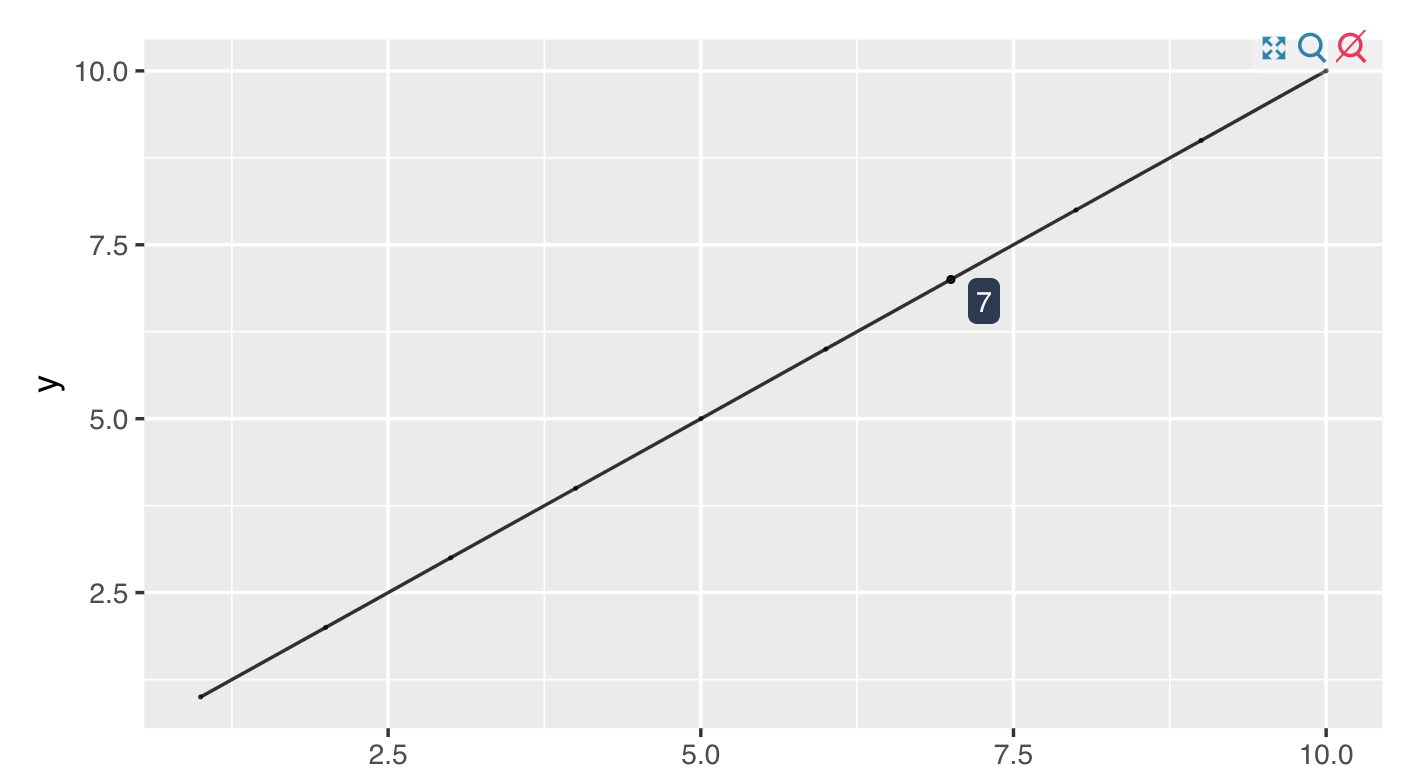
一种解决方案是添加一个geom_point_interactive来表示值。你可以用很小的一点(size = 0.05)来隐藏它们。
geom_point_interactive(aes(x = x,
             y = y,
             tooltip = x,
             data_id = x), size = 0.05)
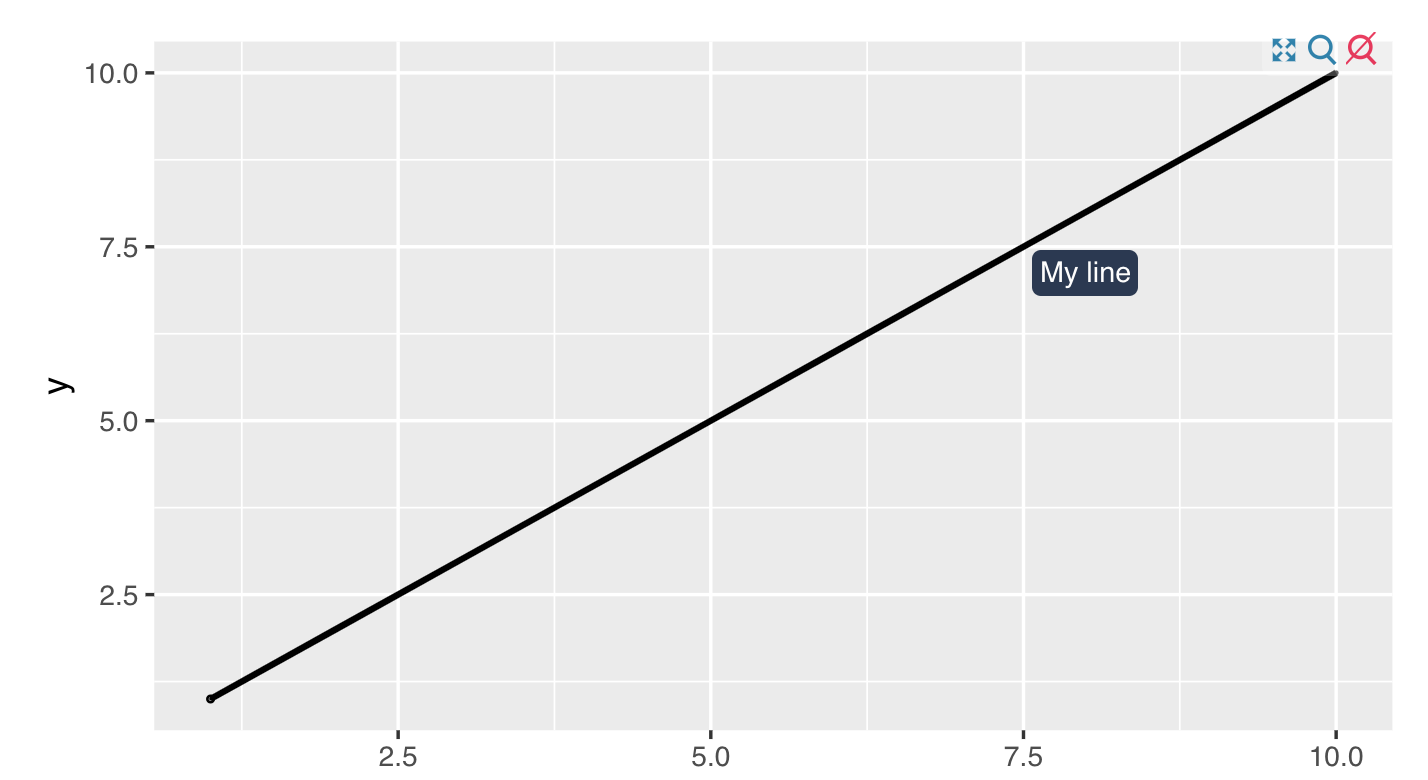
如果您还想在整个行中获得一些信息,可以将其作为一个不同的变量添加到geom_line_interactive aes()中,即tooltip = "My line"
geom_line_interactive(aes(x = x,
             y = y,
             tooltip = "My line",
             data_id = x)) +
geom_point_interactive(aes(x = x,
             y = y,
             tooltip = x,
             data_id = x), size = 0.05)
页面原文内容由Stack Overflow提供。腾讯云小微IT领域专用引擎提供翻译支持
原文链接:
https://stackoverflow.com/questions/72030757
复制相关文章
相似问题
腾讯云开发者

Copyright © 2013 - 2026 Tencent Cloud. All Rights Reserved. 腾讯云 版权所有
深圳市腾讯计算机系统有限公司 ICP备案/许可证号:粤B2-20090059 ![]() 粤公网安备44030502008569号
粤公网安备44030502008569号
腾讯云计算(北京)有限责任公司 京ICP证150476号 | 京ICP备11018762号