
ElasticSearch和Apm搜索阶段执行异常:[script_exception]原因:链接错误
我安装了ElasticSrarch和Kibana之后,在windows服务器2019和2022上添加了集成机队和Apm (现在激活,所有堆栈版本都是8.1.2)。对于客户端,我使用AspNetCore示例表单OpenTelemetry Github存储库。当我将Apm发送到windows服务器2022时,我没有任何问题,但是当我发送到2019年并尝试从可观察的角度访问apm服务时,我得到了以下错误。
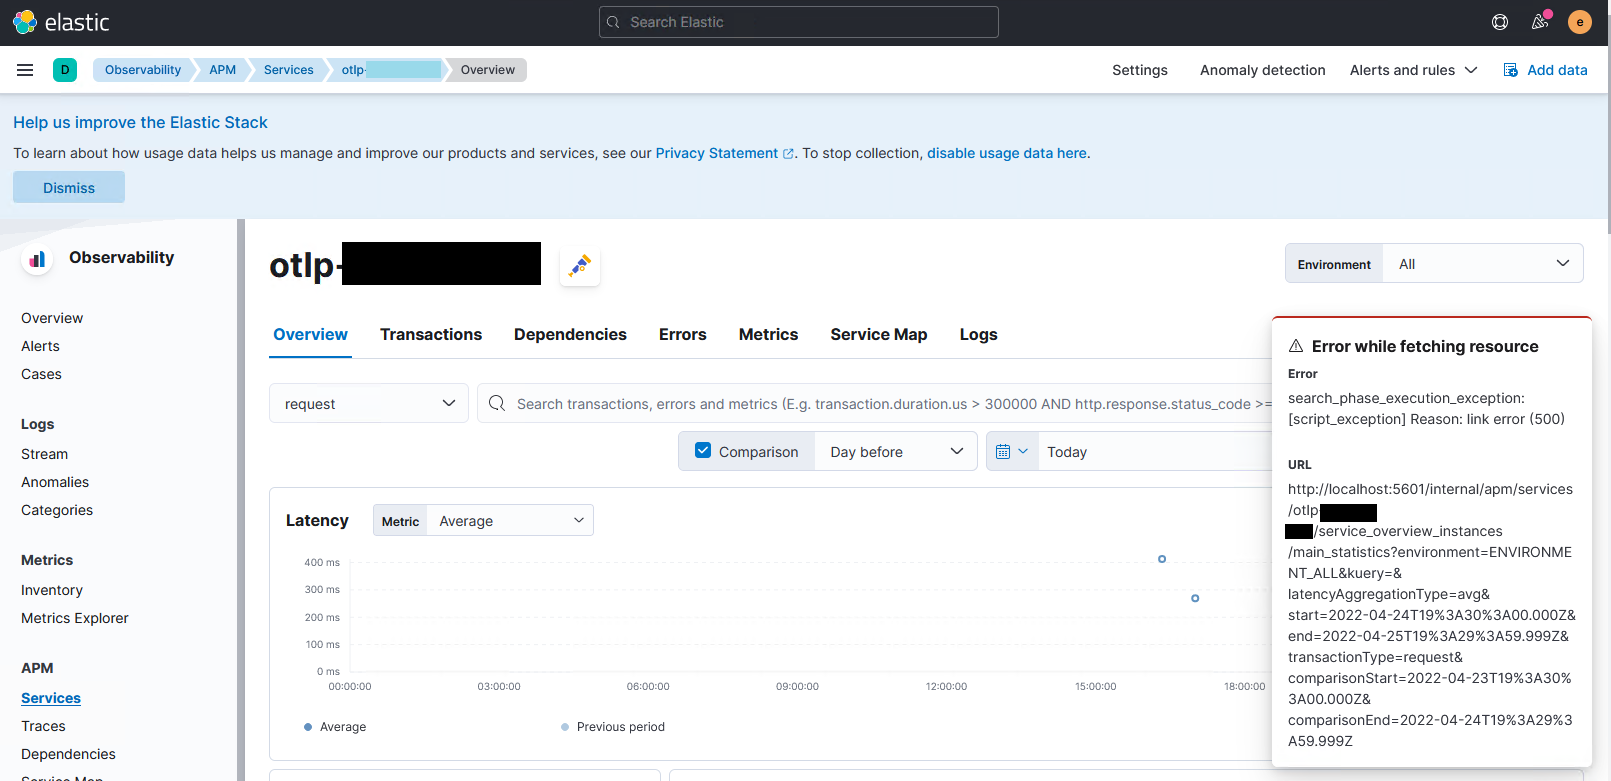
此错误记录如下:
[2022-04-18T14:34:22.619+04:30][ERROR][plugins.apm] Error: search_phase_execution_exception: [script_exception] Reason: link error
    at D:\ElasticStack\kibana\x-pack\plugins\observability\common\utils\unwrap_es_response.js:60:11
    at runMicrotasks (<anonymous>)
    at processTicksAndRejections (node:internal/process/task_queues:96:5)
    at getServiceInstancesSystemMetricStatistics (D:\ElasticStack\kibana\x-pack\plugins\apm\server\routes\services\get_service_instances\get_service_instances_system_metric_statistics.js:126:20)
    at async Promise.all (index 1)
    at D:\ElasticStack\kibana\x-pack\plugins\apm\server\routes\services\get_service_instances\main_statistics.js:28:51
    at async Promise.all (index 0)
    at handler (D:\ElasticStack\kibana\x-pack\plugins\apm\server\routes\services\route.js:622:45)
    at D:\ElasticStack\kibana\x-pack\plugins\apm\server\routes\apm_routes\register_apm_server_routes.js:143:13
    at Router.handle (D:\ElasticStack\kibana\src\core\server\http\router\router.js:163:30)
    at handler (D:\ElasticStack\kibana\src\core\server\http\router\router.js:124:50)
    at exports.Manager.execute (D:\ElasticStack\kibana\node_modules\@hapi\hapi\lib\toolkit.js:60:28)
    at Object.internals.handler (D:\ElasticStack\kibana\node_modules\@hapi\hapi\lib\handler.js:46:20)
    at exports.execute (D:\ElasticStack\kibana\node_modules\@hapi\hapi\lib\handler.js:31:20)
    at Request._lifecycle (D:\ElasticStack\kibana\node_modules\@hapi\hapi\lib\request.js:371:32)
    at Request._execute (D:\ElasticStack\kibana\node_modules\@hapi\hapi\lib\request.js:281:9)
Response: {
  error: {
    root_cause: [
      {
        type: 'script_exception',
        reason: 'link error',
        script_stack: [ "doc['system.memory.actual.free']", '     ^---- HERE' ],
        script: "1 - doc['system.memory.actual.free'] / doc['system.memory.total']",
        lang: 'expression'
      }
    ],
    type: 'search_phase_execution_exception',
    reason: 'all shards failed',
    phase: 'query',
    grouped: true,
    failed_shards: [
      {
        shard: 0,
        index: '.ds-metrics-apm.internal-default-2022.04.17-000001',
        node: 'KsqpLySITbOWAlCPlvsdSg',
        reason: {
          type: 'script_exception',
          reason: 'link error',
          script_stack: [ "doc['system.memory.actual.free']", '     ^---- HERE' ],
          script: "1 - doc['system.memory.actual.free'] / doc['system.memory.total']",
          lang: 'expression',
          caused_by: {
            type: 'parse_exception',
            reason: 'Field [system.memory.actual.free] does not exist in mappings'
          }
        }
      }
    ]
  },
  status: 400
}
我比较服务器和代理都信任,但我找不到任何区别。为什么会出现此消息和错误,以及如何解决?
回答 1
Stack Overflow用户
发布于 2022-05-19 17:07:26
我两周前发现了这个问题,经过几天的忙碌之后,我会把它寄到这里。还有,我觉得是个虫子。
在一般和快速的答案中,您应该添加包含CPU和内存基准的APM指标。在下面的几行中,我详细描述了我的情况。
WindowsServer2022 VPS是一个开发测试环境,我使用弹性APM库启动了我的项目。这个库收集CPU和内存度量,并在默认配置下以APM度量的形式发送它们。之后,我更改了我的库并使用了OpentTelemetry。新的不发送CPU和内存基准测试,我在测试中忽略它,因为它在我的使用中并不明显。当我从开发转移到使用一个干净的弹性安装的阶段环境时,出现了一个错误。经过一些调试后,我发现如果添加CPU和内存度量,问题就会得到解决。我在我的第一个弹性APM库中添加了度量,但是其他人可以使用Kibana并添加一些假的度量。对于第二种方法,您可以看到Ovidiu 评论。
https://stackoverflow.com/questions/72009663
复制相似问题
腾讯云开发者

Copyright © 2013 - 2026 Tencent Cloud. All Rights Reserved. 腾讯云 版权所有
深圳市腾讯计算机系统有限公司 ICP备案/许可证号:粤B2-20090059 ![]() 粤公网安备44030502008569号
粤公网安备44030502008569号
腾讯云计算(北京)有限责任公司 京ICP证150476号 | 京ICP备11018762号